\n
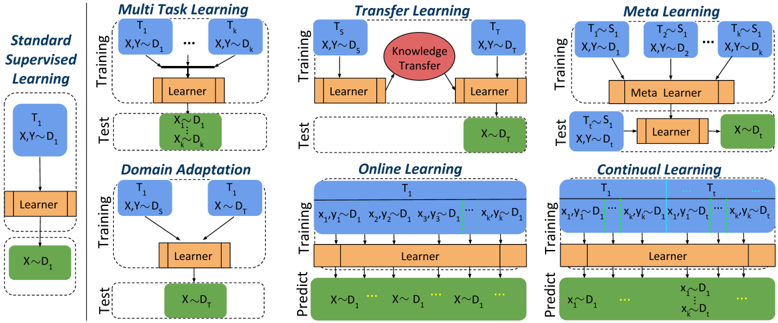
## Diagram: Machine Learning Paradigms Comparison
### Overview
The image is a technical diagram comparing six different machine learning paradigms. It visually contrasts their training and testing/prediction workflows using a consistent color-coded schematic. The primary language is English. The diagram is structured as a grid with one column on the left for the baseline and a 2x3 grid for the other paradigms.
### Components/Axes
The diagram is segmented into six distinct boxes, each representing a learning paradigm. Each box is divided into two horizontal sections: **Training** (top) and **Test** or **Predict** (bottom).
**Color Legend (Implicit):**
* **Blue Boxes:** Represent Tasks (labeled T₁, T₂, etc.) and their associated data distributions (D₁, D₂, etc.).
* **Orange Boxes:** Represent a "Learner" model.
* **Green Boxes:** Represent data used for testing or prediction.
* **Red Oval:** Represents "Knowledge Transfer" (only in Transfer Learning).
* **Light Orange Box:** Represents a "Meta Learner" (only in Meta Learning).
**Spatial Layout:**
* **Left Column:** Contains the baseline paradigm, "Standard Supervised Learning."
* **Right 2x3 Grid:** Contains the other five paradigms. The top row (left to right): Multi Task Learning, Transfer Learning, Meta Learning. The bottom row (left to right): Domain Adaptation, Online Learning, Continual Learning.
### Detailed Analysis
**1. Standard Supervised Learning (Left Column)**
* **Training:** A single task `T₁` with data `(X,Y) ~ D₁` feeds into a `Learner`.
* **Test:** The trained `Learner` is applied to new data `X ~ D₁`.
**2. Multi Task Learning (Top-Left of Grid)**
* **Training:** Multiple tasks `T₁` to `Tₙ`, each with data `(X,Y) ~ D₁` to `(X,Y) ~ Dₙ`, all feed into a single shared `Learner`.
* **Test:** The shared `Learner` is applied to data `X ~ D₂` (a different distribution than any training distribution).
**3. Transfer Learning (Top-Center of Grid)**
* **Training:** A source task `Tₛ` with data `(X,Y) ~ D₁` feeds into a `Learner`. A red oval labeled `Knowledge Transfer` connects this to a second `Learner` for a target task `Tₜ` with data `(X,Y) ~ D₂`.
* **Test:** The target task's `Learner` is applied to data `X ~ D₂`.
**4. Meta Learning (Top-Right of Grid)**
* **Training:** Multiple tasks `T₁` to `Tₙ`, each with data `(X,Y) ~ D₁`, feed into a `Meta Learner`.
* **Test:** A new task `Tₜ ~ Sₜ` (where `Sₜ` likely represents a task distribution) with data `(X,Y) ~ D₂` is given to the `Meta Learner`, which produces a new task-specific `Learner`. This new `Learner` is then applied to data `X ~ D₂`.
**5. Domain Adaptation (Bottom-Left of Grid)**
* **Training:** Two tasks, `T₁` and `T₂`, both with data `(X,Y) ~ D₁`, feed into a single `Learner`.
* **Test:** The `Learner` is applied to data `X ~ D₂`.
**6. Online Learning (Bottom-Center of Grid)**
* **Training:** A single task `T₁` receives a sequential stream of data points: `(x₁,y₁) ~ D₁, (x₂,y₂) ~ D₁, ..., (xₙ,yₙ) ~ D₁`. All points feed into the `Learner`.
* **Predict:** The `Learner` makes predictions on a sequential stream of new data: `X ~ D₂, X ~ D₂, X ~ D₂, ...`.
**7. Continual Learning (Bottom-Right of Grid)**
* **Training:** A sequence of tasks `T₁` to `Tₙ`, each with its own data stream `(x₁,y₁) ~ D₁, ..., (xₙ,yₙ) ~ D₁`, all feed into a single `Learner`.
* **Predict:** The `Learner` must handle a mixed stream of data: `X ~ D₂, ...` (new domain) and also `x₁ ~ D₁, ..., xₙ ~ D₁, ...` (data from previous tasks/domains).
### Key Observations
* **Consistent Visual Language:** The diagram uses identical shapes and colors for analogous components (tasks, learners, data) across all paradigms, enabling direct visual comparison.
* **Increasing Complexity:** The paradigms progress from a simple single-task setup (Standard) to more complex scenarios involving multiple tasks, sequential data, or knowledge transfer.
* **Key Differentiators:** The critical differences lie in the *number of tasks* during training, the *relationship between training and test data distributions* (same D₁ vs. different D₂), and the *structure of the learning process* (single learner, meta-learner, sequential updates).
* **Data Flow:** Arrows clearly indicate the direction of information flow from data/tasks, through the learner(s), to the output (test/predict).
### Interpretation
This diagram serves as a conceptual map for understanding the landscape of modern machine learning approaches beyond basic supervised learning. It highlights how each paradigm addresses a specific challenge:
* **Multi Task Learning** aims to improve generalization by learning related tasks jointly.
* **Transfer Learning** leverages knowledge from a rich source domain to perform better on a target domain with potentially less data.
* **Meta Learning** ("learning to learn") focuses on creating models that can rapidly adapt to new tasks with minimal data.
* **Domain Adaptation** specifically tackles the problem where training and test data come from different but related distributions.
* **Online and Continual Learning** deal with non-stationary environments where data arrives sequentially, and the model must update or remember without catastrophic forgetting.
The visual juxtaposition emphasizes that the choice of paradigm depends fundamentally on the structure of the available data (single vs. multiple tasks, static vs. sequential) and the ultimate goal (generalization, adaptation, or lifelong learning). The consistent use of `D₁` for training and `D₂` for testing in most paradigms (except Standard) underscores the common challenge of distributional shift that these advanced methods are designed to overcome.