# Technical Document Extraction
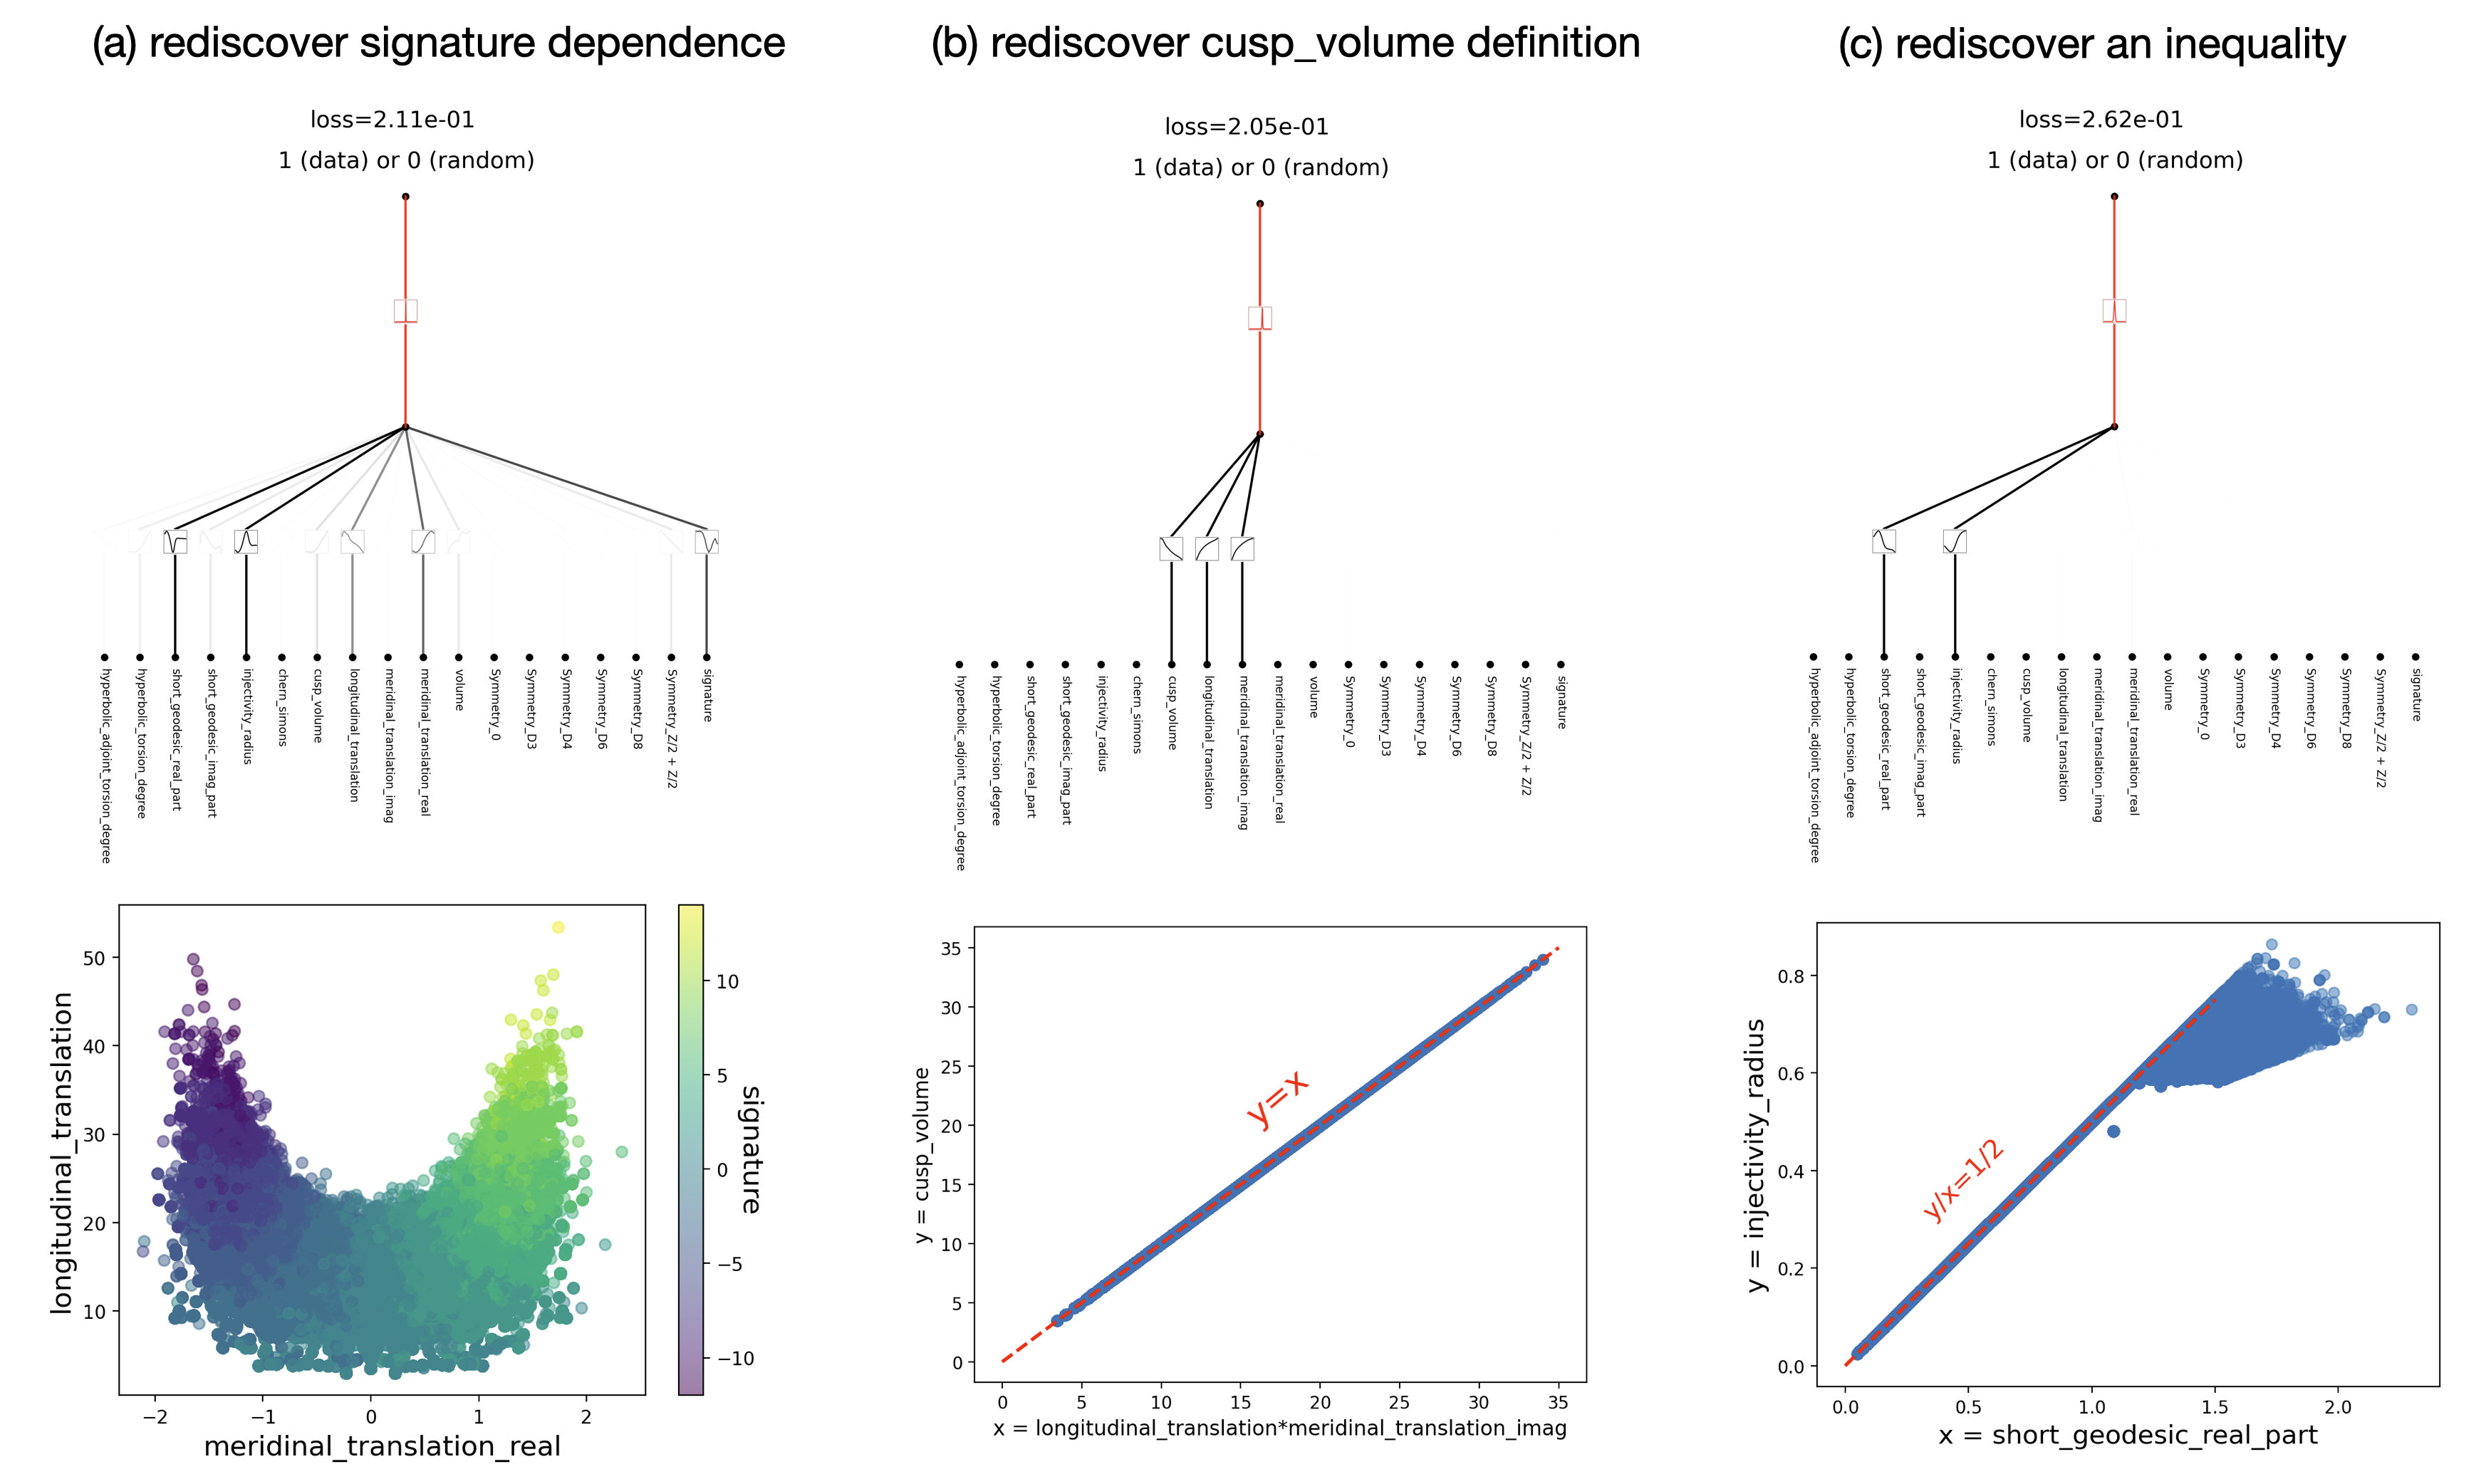
## Panel (a): rediscover signature dependence
### Tree Diagram
- **Root Node**:
- Loss: `2.11e-01`
- Label: `1 (data) or 0 (random)`
- **Branches**:
- `hyperbolic_geodesic`
- `short_geodesic`
- `objectivity`
- `dem_volumes`
- `metric_translation`
- `longitudinal_translation`
- `cusp_volume`
- `symmetry_D3`
- `symmetry_D4`
- `symmetry_D6`
- `symmetry_D8`
- `signature`
### Scatter Plot
- **Axes**:
- X-axis: `meridional_translation_real`
- Y-axis: `longitudinal_translation`
- **Colorbar**:
- Label: `signature`
- Range: `-10` (purple) to `10` (yellow)
- **Legend**:
- Position: Top-right (not visible in image)
- Colors: Match colorbar gradient
## Panel (b): rediscover cusp_volume definition
### Tree Diagram
- **Root Node**:
- Loss: `2.05e-01`
- Label: `1 (data) or 0 (random)`
- **Branches**:
- `hyperbolic_geodesic`
- `short_geodesic`
- `objectivity`
- `dem_volumes`
- `cusp_volume`
- `metric_translation`
- `longitudinal_translation`
- `symmetry_D3`
- `symmetry_D4`
- `symmetry_D6`
- `symmetry_D8`
- `signature`
### Scatter Plot
- **Axes**:
- X-axis: `longitudinal_translation*meridional_translation_imag`
- Y-axis: `cusp_volume`
- **Line**:
- Equation: `y = x` (red dashed line)
- **Legend**:
- Position: Top-right (not visible in image)
## Panel (c): rediscover an inequality
### Tree Diagram
- **Root Node**:
- Loss: `2.62e-01`
- Label: `1 (data) or 0 (random)`
- **Branches**:
- `hyperbolic_geodesic`
- `short_geodesic`
- `objectivity`
- `dem_volumes`
- `cusp_volume`
- `metric_translation`
- `longitudinal_translation`
- `symmetry_D3`
- `symmetry_D4`
- `symmetry_D6`
- `symmetry_D8`
- `signature`
### Scatter Plot
- **Axes**:
- X-axis: `short_geodesic_real_part`
- Y-axis: `injectivity_radius`
- **Line**:
- Equation: `y = x/2` (red dashed line)
- **Legend**:
- Position: Top-right (not visible in image)
## Common Elements
- **Colorbar**:
- Label: `signature`
- Range: `-10` (purple) to `10` (yellow)
- Position: Right side of all scatter plots
- **Legend**:
- Position: Top-right corner (not visible in image)
- Colors: Match colorbar gradient
## Key Observations
1. **Loss Values**:
- Panel (a): `2.11e-01`
- Panel (b): `2.05e-01`
- Panel (c): `2.62e-01`
2. **Scatter Plot Trends**:
- Panel (a): Data points form a U-shaped distribution with high signature values (yellow) in the upper-right quadrant.
- Panel (b): Linear relationship (`y=x`) between `longitudinal_translation*meridional_translation_imag` and `cusp_volume`.
- Panel (c): Linear relationship (`y=x/2`) between `short_geodesic_real_part` and `injectivity_radius`.
## Spatial Grounding
- **Colorbar**: Right-aligned across all panels.
- **Legend**: Top-right corner (not visible in image).
- **Tree Diagrams**: Positioned above scatter plots in each panel.
## Language Notes
- All text is in English. No other languages detected.