## Bar Chart: Mean Accuracy Across Mathematical Topics
### Overview
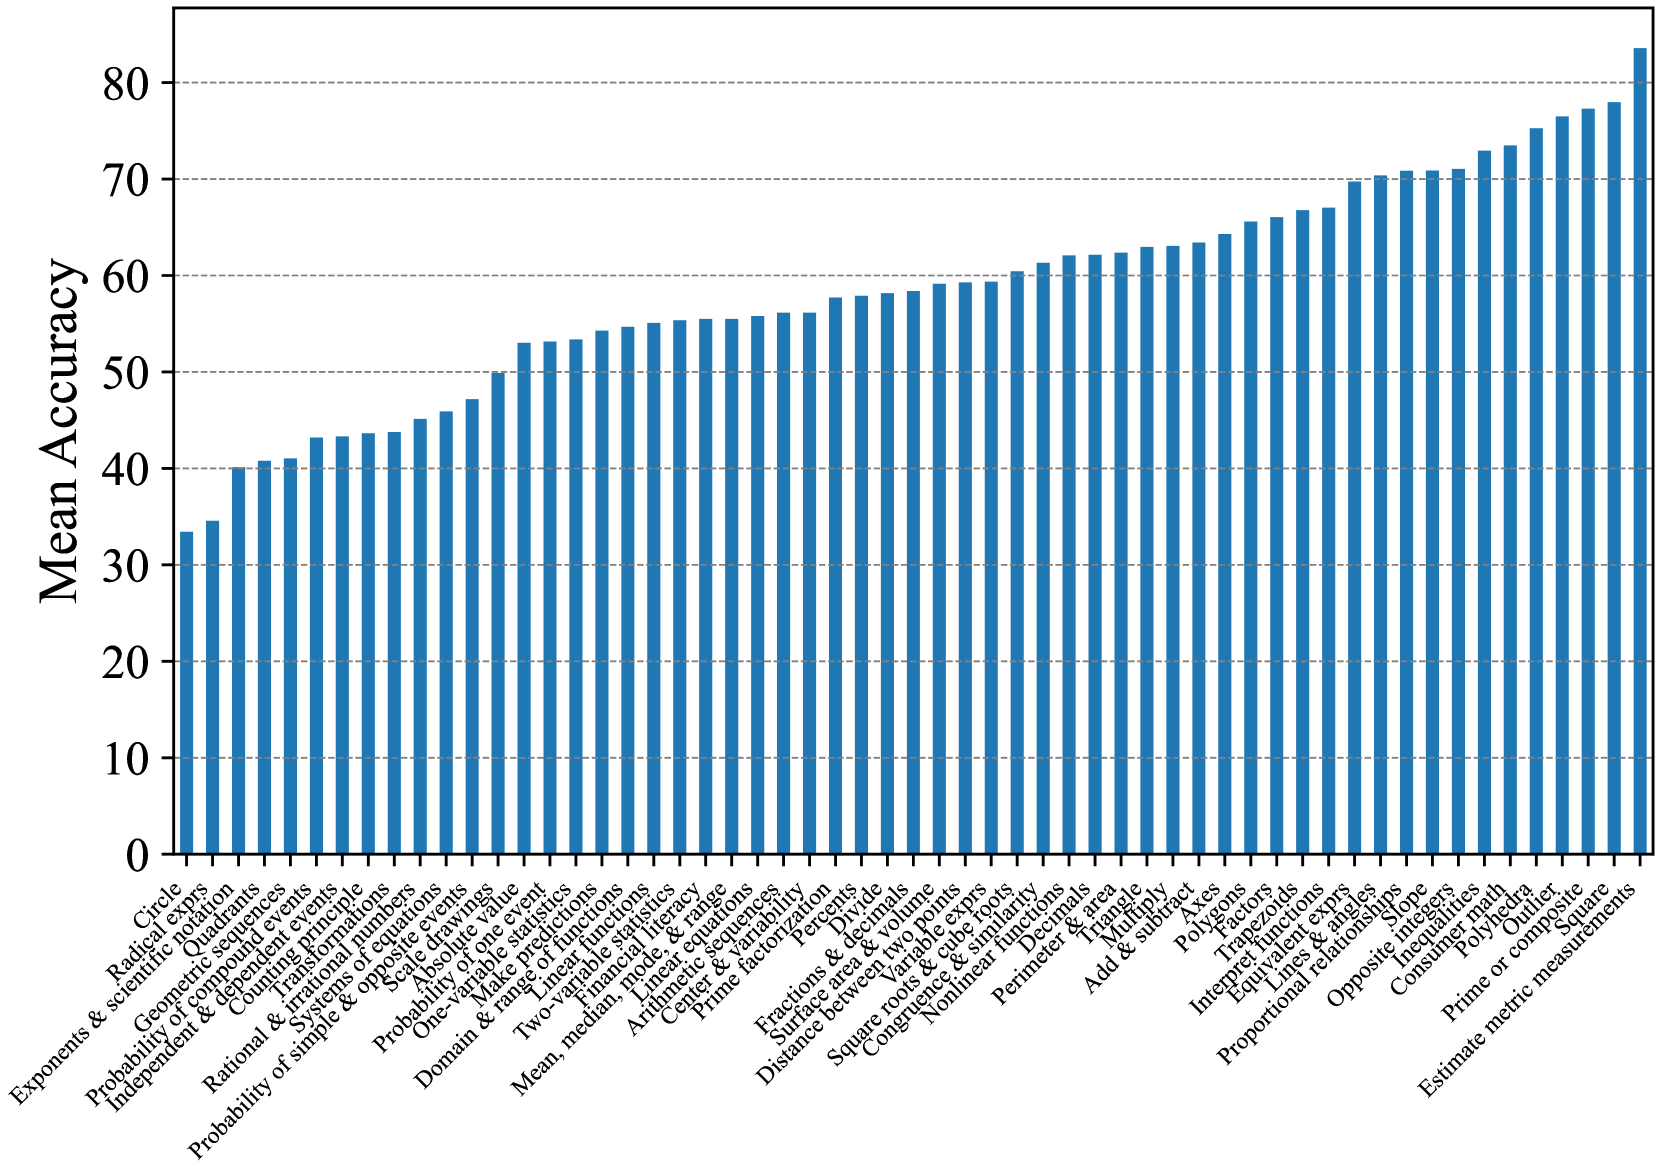
This image is a vertical bar chart displaying the "Mean Accuracy" scores for a wide range of mathematical topics. The chart is sorted in ascending order of accuracy, from the lowest-performing topic on the left to the highest-performing topic on the right. The data suggests a performance evaluation, likely from an assessment or learning platform, across numerous specific math skills.
### Components/Axes
* **Chart Type:** Vertical Bar Chart.
* **Y-Axis (Vertical):**
* **Label:** "Mean Accuracy"
* **Scale:** Linear scale from 0 to 80.
* **Major Grid Lines:** Horizontal dashed lines at intervals of 10 (0, 10, 20, 30, 40, 50, 60, 70, 80).
* **X-Axis (Horizontal):**
* **Label:** None explicit. The axis contains categorical labels for each bar.
* **Categories:** 62 distinct mathematical topics, listed below in order from left (lowest accuracy) to right (highest accuracy). The labels are rotated approximately 45 degrees for readability.
* **Legend:** Not present. Each bar represents a single data series ("Mean Accuracy").
* **Data Series:** A single series of blue bars. The color is a consistent medium blue across all bars.
### Detailed Analysis
The following table lists each mathematical topic (x-axis category) and its approximate mean accuracy value (y-axis), estimated from the bar height relative to the grid lines. Values are approximate due to visual estimation.
| Order (L→R) | Mathematical Topic (X-Axis Label) | Approx. Mean Accuracy |
| :--- | :--- | :--- |
| 1 | Circle | ~33 |
| 2 | Radical exprs | ~34 |
| 3 | Exponents & scientific notation | ~40 |
| 4 | Quadratics | ~41 |
| 5 | Geometric sequences | ~41 |
| 6 | Probability of compound events | ~43 |
| 7 | Independent & dependent events | ~43 |
| 8 | Counting principle | ~44 |
| 9 | Transformations | ~44 |
| 10 | Rational & irrational numbers | ~45 |
| 11 | Systems of equations | ~46 |
| 12 | Simple & opposite events | ~47 |
| 13 | Scale drawings | ~50 |
| 14 | Absolute value | ~53 |
| 15 | Probability of one event | ~53 |
| 16 | One-variable statistics | ~54 |
| 17 | Make predictions | ~55 |
| 18 | Linear functions | ~55 |
| 19 | Domain & range of functions | ~55 |
| 20 | Two-variable statistics | ~56 |
| 21 | Financial literacy | ~56 |
| 22 | Mean, median, mode & range | ~56 |
| 23 | Arithmetic sequences | ~57 |
| 24 | Linear equations | ~58 |
| 25 | Center & variation | ~58 |
| 26 | Prime factorization | ~58 |
| 27 | Percents | ~59 |
| 28 | Fractions & decimals | ~59 |
| 29 | Surface area & volume | ~60 |
| 30 | Distance between two points | ~61 |
| 31 | Variable expressions | ~62 |
| 32 | Square roots & cube roots | ~62 |
| 33 | Congruence & similarity | ~62 |
| 34 | Nonlinear functions | ~63 |
| 35 | Decimals | ~63 |
| 36 | Perimeter & area | ~64 |
| 37 | Translate | ~65 |
| 38 | Multiply | ~66 |
| 39 | Add & subtract | ~67 |
| 40 | Axes | ~67 |
| 41 | Polygons | ~70 |
| 42 | Factors | ~70 |
| 43 | Trapezoids | ~71 |
| 44 | Interpret functions | ~71 |
| 45 | Equivalent expressions | ~71 |
| 46 | Lines & angles | ~73 |
| 47 | Proportional relationships | ~73 |
| 48 | Slope | ~75 |
| 49 | Opposite integers | ~76 |
| 50 | Inequalities | ~77 |
| 51 | Consecutive math | ~78 |
| 52 | Polyhedra | ~78 |
| 53 | Outlier | ~79 |
| 54 | Prime or composite | ~80 |
| 55 | Estimate metric measurements | ~83 |
### Key Observations
1. **Clear Ascending Trend:** The chart is explicitly sorted by performance. There is a strong, nearly monotonic increase in mean accuracy from left to right.
2. **Performance Range:** Accuracy scores span approximately 50 percentage points, from a low of ~33% to a high of ~83%.
3. **Clustering:** Topics cluster in performance bands. For example:
* **Lowest Tier (~33-47%):** Foundational but abstract concepts like Circle, Radicals, Exponents, Probability, and Transformations.
* **Middle Tier (~50-64%):** Core algebra and statistics topics like Linear Functions, Equations, Statistics, and Geometry basics.
* **Highest Tier (~65-83%):** More concrete or procedural skills like basic arithmetic operations (Add, Multiply), shape identification (Polygons, Trapezoids), and fundamental properties (Slope, Inequalities, Prime/Composite).
4. **Highest & Lowest:** The lowest accuracy is for "Circle" (~33%). The highest accuracy is for "Estimate metric measurements" (~83%).
5. **Notable Jumps:** There are noticeable jumps in accuracy between some adjacent topics, such as from "Simple & opposite events" (~47%) to "Scale drawings" (~50%), and from "Axes" (~67%) to "Polygons" (~70%).
### Interpretation
This chart likely represents aggregated performance data from a mathematics assessment or learning system. The sorting reveals a potential hierarchy of difficulty or student mastery.
* **Conceptual vs. Procedural:** The data suggests that students struggle most with abstract, conceptual, or multi-step topics (e.g., Circle area formulas, radical expressions, compound probability). They perform best on concrete, procedural, or foundational arithmetic and geometry skills (e.g., estimating measurements, identifying shapes, performing basic operations).
* **Curriculum Implications:** The topics on the left side of the chart (e.g., Quadratics, Systems of Equations, Transformations) may require targeted instructional support or revised teaching strategies. The high performance on topics like "Slope" and "Proportional relationships" indicates these are well-understood core concepts.
* **Data Limitation:** The chart shows "Mean Accuracy," which aggregates performance. It does not reveal the distribution of scores (e.g., standard deviation), the number of students assessed per topic, or whether the topics were assessed under identical conditions. The ordering is by value, not by any inherent curricular sequence.
* **Underlying Question:** The chart answers "What math topics do students find most and least challenging?" based on this specific dataset. The clear gradient implies the assessment successfully differentiated between varying levels of conceptual difficulty or student preparedness.