TECHNICAL ASSET FINGERPRINT
9b0fe0444e91bae6eab8a5ce
Click to view fullscreen
Press ESC or click to close
FOUND IN PAPERS
EXPERT: gemma-3-27b-it-free VERSION 1
RUNTIME: google-free/gemma-3-27b-it
INTEL_VERIFIED
## Line Chart: Answer Accuracy vs. Layer for Llama Models
### Overview
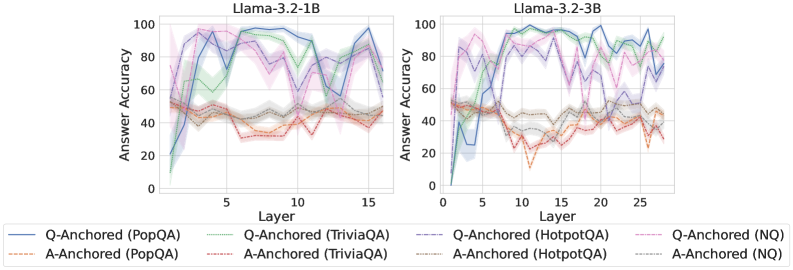
The image presents two line charts comparing the answer accuracy of different question-answering (QA) datasets across layers in two Llama models: Llama-3.2-1B and Llama-3.2-3B. The x-axis represents the layer number, and the y-axis represents the answer accuracy, ranging from 0 to 100. Each line represents a different QA dataset and anchoring method.
### Components/Axes
* **X-axis:** Layer (ranging from 0 to 15 for Llama-3.2-1B and 0 to 25 for Llama-3.2-3B).
* **Y-axis:** Answer Accuracy (ranging from 0 to 100).
* **Left Chart Title:** Llama-3.2-1B
* **Right Chart Title:** Llama-3.2-3B
* **Legend:**
* Blue Line: Q-Anchored (PopQA)
* Orange Line: A-Anchored (PopQA)
* Green Line: Q-Anchored (TriviaQA)
* Light Blue Line: A-Anchored (TriviaQA)
* Purple Dashed Line: Q-Anchored (HotpotQA)
* Red Dashed Line: A-Anchored (HotpotQA)
* Gray Line: Q-Anchored (NQ)
* Brown Line: A-Anchored (NQ)
### Detailed Analysis or Content Details
**Llama-3.2-1B Chart:**
* **Q-Anchored (PopQA) (Blue Line):** Starts at approximately 20 accuracy at layer 0, rises sharply to a peak of around 95 accuracy at layer 5, fluctuates between 80 and 95 accuracy until layer 12, and then declines to approximately 70 accuracy at layer 15.
* **A-Anchored (PopQA) (Orange Line):** Starts at approximately 30 accuracy at layer 0, rises to a peak of around 55 accuracy at layer 2, remains relatively stable between 45 and 60 accuracy until layer 10, and then declines to approximately 40 accuracy at layer 15.
* **Q-Anchored (TriviaQA) (Green Line):** Starts at approximately 30 accuracy at layer 0, rises to a peak of around 90 accuracy at layer 5, fluctuates between 75 and 90 accuracy until layer 12, and then declines to approximately 75 accuracy at layer 15.
* **A-Anchored (TriviaQA) (Light Blue Line):** Starts at approximately 35 accuracy at layer 0, rises to a peak of around 65 accuracy at layer 2, remains relatively stable between 50 and 65 accuracy until layer 10, and then declines to approximately 50 accuracy at layer 15.
* **Q-Anchored (HotpotQA) (Purple Dashed Line):** Starts at approximately 40 accuracy at layer 0, rises to a peak of around 85 accuracy at layer 5, fluctuates between 70 and 85 accuracy until layer 12, and then declines to approximately 70 accuracy at layer 15.
* **A-Anchored (HotpotQA) (Red Dashed Line):** Starts at approximately 45 accuracy at layer 0, rises to a peak of around 60 accuracy at layer 2, remains relatively stable between 50 and 60 accuracy until layer 10, and then declines to approximately 45 accuracy at layer 15.
* **Q-Anchored (NQ) (Gray Line):** Starts at approximately 25 accuracy at layer 0, rises to a peak of around 70 accuracy at layer 5, fluctuates between 60 and 70 accuracy until layer 12, and then declines to approximately 60 accuracy at layer 15.
* **A-Anchored (NQ) (Brown Line):** Starts at approximately 35 accuracy at layer 0, rises to a peak of around 50 accuracy at layer 2, remains relatively stable between 40 and 50 accuracy until layer 10, and then declines to approximately 40 accuracy at layer 15.
**Llama-3.2-3B Chart:**
* **Q-Anchored (PopQA) (Blue Line):** Starts at approximately 20 accuracy at layer 0, rises sharply to a peak of around 95 accuracy at layer 5, fluctuates between 85 and 95 accuracy until layer 20, and then declines to approximately 80 accuracy at layer 25.
* **A-Anchored (PopQA) (Orange Line):** Starts at approximately 30 accuracy at layer 0, rises to a peak of around 55 accuracy at layer 2, remains relatively stable between 45 and 60 accuracy until layer 15, and then declines to approximately 40 accuracy at layer 25.
* **Q-Anchored (TriviaQA) (Green Line):** Starts at approximately 30 accuracy at layer 0, rises to a peak of around 90 accuracy at layer 5, fluctuates between 75 and 90 accuracy until layer 20, and then declines to approximately 75 accuracy at layer 25.
* **A-Anchored (TriviaQA) (Light Blue Line):** Starts at approximately 35 accuracy at layer 0, rises to a peak of around 65 accuracy at layer 2, remains relatively stable between 50 and 65 accuracy until layer 15, and then declines to approximately 50 accuracy at layer 25.
* **Q-Anchored (HotpotQA) (Purple Dashed Line):** Starts at approximately 40 accuracy at layer 0, rises to a peak of around 85 accuracy at layer 5, fluctuates between 70 and 85 accuracy until layer 20, and then declines to approximately 70 accuracy at layer 25.
* **A-Anchored (HotpotQA) (Red Dashed Line):** Starts at approximately 45 accuracy at layer 0, rises to a peak of around 60 accuracy at layer 2, remains relatively stable between 50 and 60 accuracy until layer 15, and then declines to approximately 45 accuracy at layer 25.
* **Q-Anchored (NQ) (Gray Line):** Starts at approximately 25 accuracy at layer 0, rises to a peak of around 70 accuracy at layer 5, fluctuates between 60 and 70 accuracy until layer 20, and then declines to approximately 60 accuracy at layer 25.
* **A-Anchored (NQ) (Brown Line):** Starts at approximately 35 accuracy at layer 0, rises to a peak of around 50 accuracy at layer 2, remains relatively stable between 40 and 50 accuracy until layer 15, and then declines to approximately 40 accuracy at layer 25.
### Key Observations
* Generally, the Q-Anchored lines exhibit higher accuracy than the A-Anchored lines across all datasets and models.
* Accuracy tends to peak around layer 5 for both models and then plateaus or slightly declines.
* The Llama-3.2-3B model generally maintains higher accuracy levels across all datasets and layers compared to the Llama-3.2-1B model.
* PopQA, TriviaQA, and HotpotQA datasets show higher accuracy compared to NQ.
### Interpretation
The charts demonstrate the impact of model size (1B vs. 3B parameters) and anchoring method (Q-Anchored vs. A-Anchored) on answer accuracy across different QA datasets. The higher accuracy of the 3B model suggests that increasing model capacity improves performance. The consistently higher accuracy of Q-Anchored methods indicates that anchoring questions is more effective than anchoring answers for these datasets. The varying performance across datasets highlights the importance of dataset characteristics in evaluating QA models. The initial rise in accuracy followed by a plateau or decline suggests that there may be a point of diminishing returns with increasing layers, and further optimization or architectural changes may be needed to sustain performance gains. The differences in accuracy between datasets could be due to variations in question complexity, data quality, or the types of reasoning required to answer the questions.
DECODING INTELLIGENCE...