\n
## Line Charts: Llama-3.2 Model Layer-wise Answer Accuracy
### Overview
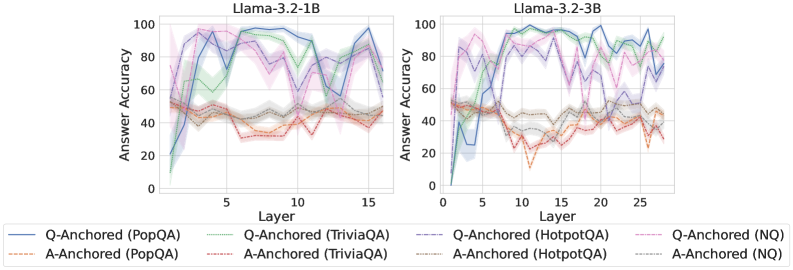
The image displays two side-by-side line charts comparing the "Answer Accuracy" across model layers for two different sizes of the Llama-3.2 model (1B and 3B parameters). Each chart plots the performance of eight different experimental conditions, which are combinations of two anchoring methods (Q-Anchored and A-Anchored) evaluated on four distinct question-answering datasets (PopQA, TriviaQA, HotpotQA, NQ).
### Components/Axes
* **Chart Titles (Top Center):**
* Left Chart: `Llama-3.2-1B`
* Right Chart: `Llama-3.2-3B`
* **Y-Axis (Left Side of Each Chart):**
* Label: `Answer Accuracy`
* Scale: 0 to 100, with major tick marks at 0, 20, 40, 60, 80, 100.
* **X-Axis (Bottom of Each Chart):**
* Label: `Layer`
* Scale (Left Chart): 0 to 15, with major tick marks at 0, 5, 10, 15.
* Scale (Right Chart): 0 to 25, with major tick marks at 0, 5, 10, 15, 20, 25.
* **Legend (Bottom Center, spanning both charts):**
* The legend defines eight series using a combination of line color, style (solid vs. dashed), and label.
* **Q-Anchored Series (Solid Lines):**
* `Q-Anchored (PopQA)` - Solid blue line.
* `Q-Anchored (TriviaQA)` - Solid green line.
* `Q-Anchored (HotpotQA)` - Solid purple line.
* `Q-Anchored (NQ)` - Solid pink line.
* **A-Anchored Series (Dashed Lines):**
* `A-Anchored (PopQA)` - Dashed orange line.
* `A-Anchored (TriviaQA)` - Dashed red line.
* `A-Anchored (HotpotQA)` - Dashed brown line.
* `A-Anchored (NQ)` - Dashed gray line.
### Detailed Analysis
**Llama-3.2-1B (Left Chart):**
* **Q-Anchored Lines (Solid):** All four lines start at low accuracy (near 0-20%) at Layer 0. They show a rapid increase, peaking between Layers 5-10. The peak accuracies are approximately: PopQA ~95%, TriviaQA ~90%, HotpotQA ~85%, NQ ~80%. After the peak, performance fluctuates significantly, with a general downward trend towards Layer 15, ending between 60-90%.
* **A-Anchored Lines (Dashed):** These lines start higher than Q-Anchored at Layer 0 (around 40-50%). They remain relatively stable and clustered together throughout all layers, fluctuating within a band of approximately 30% to 55% accuracy. There is no strong upward or downward trend. A notable dip occurs for `A-Anchored (TriviaQA)` (dashed red) around Layer 10, dropping to near 30%.
**Llama-3.2-3B (Right Chart):**
* **Q-Anchored Lines (Solid):** Similar initial pattern to the 1B model, starting low and rising sharply. However, the peak accuracies are higher and are sustained over more layers. Peak accuracies are approximately: PopQA ~98%, TriviaQA ~95%, HotpotQA ~90%, NQ ~85%. The lines exhibit high volatility after Layer 10, with sharp drops and recoveries, particularly for `Q-Anchored (HotpotQA)` (solid purple), which drops to near 60% around Layer 15 before recovering.
* **A-Anchored Lines (Dashed):** These lines start around 50% accuracy at Layer 0. They show more variation than in the 1B model but remain generally lower than the Q-Anchored lines after the initial layers. They fluctuate mostly between 40% and 65%. The `A-Anchored (TriviaQA)` (dashed red) line shows a significant dip to near 10% around Layer 12.
### Key Observations
1. **Anchoring Method Disparity:** There is a clear and consistent separation between the two anchoring methods. Q-Anchored approaches (solid lines) achieve significantly higher peak accuracy than A-Anchored approaches (dashed lines) in both model sizes.
2. **Model Size Effect:** The larger 3B model achieves higher peak accuracies for the Q-Anchored methods and maintains high performance across a broader range of middle layers compared to the 1B model.
3. **Layer-wise Trend:** Q-Anchored performance follows a distinct "rise-peak-fluctuate/decline" pattern across layers. A-Anchored performance is more stable and flat across layers.
4. **Dataset Variability:** Performance varies by dataset within each anchoring method. For Q-Anchored, PopQA generally yields the highest accuracy, followed by TriviaQA, HotpotQA, and NQ.
5. **Volatility:** The 3B model's Q-Anchored lines show greater volatility (sharper peaks and troughs) in the later layers compared to the 1B model.
### Interpretation
The data suggests a fundamental difference in how information is utilized across model layers depending on the anchoring strategy. The **Q-Anchored** method appears to leverage intermediate layers (5-10 for 1B, 5-15 for 3B) very effectively for answer accuracy, indicating these layers may be crucial for processing the question-centric information needed for these QA tasks. The subsequent volatility might reflect over-specialization or interference in deeper layers.
In contrast, the **A-Anchored** method shows a more consistent, but lower, performance profile. This could imply it relies on a more distributed or less layer-specific representation, or that it is less effective at extracting the necessary signals from the model's hidden states for these benchmarks.
The performance gap between the two methods widens with model scale (from 1B to 3B parameters), suggesting that the advantage of the Q-Anchored approach becomes more pronounced in larger models. The significant dips in performance for specific datasets at certain layers (e.g., TriviaQA for A-Anchored) may point to architectural characteristics or training data biases that create "weak spots" for particular types of knowledge retrieval at specific processing depths.