## Line Graph: Answer Accuracy Across Transformer Layers for Llama-3.2 Models
### Overview
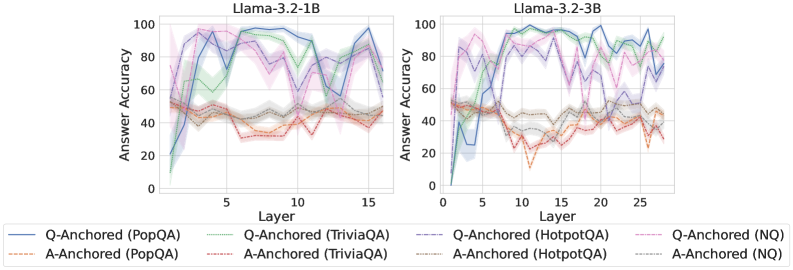
The image contains two side-by-side line graphs comparing answer accuracy across transformer layers for two versions of the Llama-3.2 model (1B and 3B parameters). Each graph shows multiple data series representing different question-answering (QA) datasets and anchoring methods (Q-Anchored vs. A-Anchored). The graphs use color-coded lines with shaded confidence intervals to visualize performance trends.
### Components/Axes
- **X-axis (Layer)**:
- Left chart: 0–15 (Llama-3.2-1B)
- Right chart: 0–25 (Llama-3.2-3B)
- **Y-axis (Answer Accuracy)**: 0–100% (both charts)
- **Legends**:
- **Left Chart (Llama-3.2-1B)**:
- Blue solid: Q-Anchored (PopQA)
- Green dotted: Q-Anchored (TriviaQA)
- Orange dashed: A-Anchored (PopQA)
- Red dotted: A-Anchored (TriviaQA)
- Purple dashed: Q-Anchored (HotpotQA)
- Pink dotted: Q-Anchored (NQ)
- Gray dashed: A-Anchored (HotpotQA)
- Black dashed: A-Anchored (NQ)
- **Right Chart (Llama-3.2-3B)**:
- Same datasets/methods as left chart but with extended layer range.
### Detailed Analysis
#### Llama-3.2-1B (Left Chart)
1. **Q-Anchored (PopQA)**:
- Blue solid line peaks at ~85% accuracy around layer 10, then declines to ~60% by layer 15.
- Confidence interval (shaded blue) narrows after layer 10.
2. **Q-Anchored (TriviaQA)**:
- Green dotted line peaks at ~75% around layer 5, drops to ~50% by layer 15.
3. **A-Anchored (PopQA)**:
- Orange dashed line peaks at ~65% around layer 10, drops to ~40% by layer 15.
4. **Q-Anchored (HotpotQA)**:
- Purple dashed line peaks at ~70% around layer 15, with high variability (60–80%).
5. **Q-Anchored (NQ)**:
- Pink dotted line remains stable at ~50–60% across all layers.
6. **A-Anchored (HotpotQA/NQ)**:
- Gray/black dashed lines show lower accuracy (~40–50%) than Q-Anchored counterparts.
#### Llama-3.2-3B (Right Chart)
1. **Q-Anchored (PopQA)**:
- Blue solid line peaks at ~90% around layer 10, drops to ~70% by layer 25.
2. **Q-Anchored (TriviaQA)**:
- Green dotted line peaks at ~80% around layer 5, declines to ~60% by layer 25.
3. **A-Anchored (PopQA)**:
- Orange dashed line peaks at ~70% around layer 20, drops to ~50% by layer 25.
4. **Q-Anchored (HotpotQA)**:
- Purple dashed line peaks at ~85% around layer 20, with sharp drops (60–90%).
5. **Q-Anchored (NQ)**:
- Pink dotted line remains stable at ~55–65% across all layers.
6. **A-Anchored (HotpotQA/NQ)**:
- Gray/black dashed lines show lower accuracy (~45–55%) than Q-Anchored.
### Key Observations
1. **Model Size Impact**:
- Llama-3.2-3B generally achieves higher peak accuracy than Llama-3.2-1B (e.g., PopQA Q-Anchored: 85% vs. 85% peak, but 3B sustains higher values longer).
2. **Dataset Variability**:
- HotpotQA shows the highest variability in both models, suggesting complexity in long-context reasoning.
3. **Anchoring Method**:
- Q-Anchored consistently outperforms A-Anchored across datasets (e.g., PopQA Q-Anchored peaks at 85–90% vs. A-Anchored at 65–70%).
4. **Layer-Specific Trends**:
- Accuracy often peaks in middle layers (5–20) before declining, indicating potential overfitting or context retention limits.
### Interpretation
The data demonstrates that **Q-Anchored methods** (using question context) outperform **A-Anchored methods** (using answer context) across all datasets and model sizes. The Llama-3.2-3B model shows improved performance in later layers compared to the 1B version, particularly for complex datasets like HotpotQA. However, the sharp drops in accuracy for A-Anchored methods (e.g., HotpotQA in Llama-3.2-3B) suggest that answer-centric anchoring struggles with long-context reasoning. The stability of NQ Q-Anchored accuracy implies it may be less sensitive to model architecture changes. These trends highlight the importance of question context in transformer-based QA systems and suggest opportunities for optimizing middle-layer representations.