## Scatter Plot: Output Set Estimation and Unsafe Region
### Overview
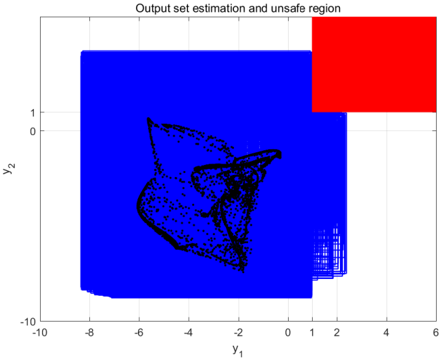
The image depicts a 2D scatter plot with a blue background, a red square in the top-right quadrant, and a cluster of black data points forming a complex shape. The plot is titled "Output set estimation and unsafe region," with axes labeled **y₁** (horizontal) and **y₂** (vertical). The red square represents an "unsafe region," while the black points represent "output set estimation."
---
### Components/Axes
- **Axes**:
- **y₁ (horizontal)**: Ranges from **-10** to **6** in increments of 2.
- **y₂ (vertical)**: Ranges from **-10** to **1** in increments of 2.
- **Legend**:
- No explicit legend is present, but the **red square** is labeled as the "unsafe region" in the title.
- The **black points** are labeled as "output set estimation" in the title.
- **Key Elements**:
- **Red Square**: Positioned in the top-right quadrant, spanning **y₁ = 1 to 6** and **y₂ = 0 to 1**.
- **Black Points**: Clustered in the lower-left quadrant, forming a jagged, irregular shape. A dense sub-cluster is visible near **y₁ = 1, y₂ = 0**.
---
### Detailed Analysis
- **Red Square (Unsafe Region)**:
- Located in the **top-right quadrant** (relative to the origin).
- Covers **y₁ = 1 to 6** and **y₂ = 0 to 1**.
- No data points (black) are present within this region, suggesting it is excluded from the output set estimation.
- **Black Points (Output Set Estimation)**:
- Distributed across **y₁ = -10 to 1** and **y₂ = -10 to 0**.
- Form a **non-linear, irregular shape** resembling a fragmented polygon or "blob."
- A **dense cluster** of points is concentrated near **y₁ = 1, y₂ = 0**, with a tail extending toward **y₁ = -10, y₂ = -10**.
- The distribution suggests a **non-uniform, possibly probabilistic or stochastic process** generating the output set.
---
### Key Observations
1. **Unsafe Region Isolation**: The red square is entirely separate from the black data points, indicating no overlap between the unsafe region and the output set estimation.
2. **Output Set Shape**: The black points form a **non-convex, fragmented structure**, suggesting the output set is not a simple geometric shape (e.g., a circle or rectangle).
3. **Dense Cluster**: The sub-cluster near **y₁ = 1, y₂ = 0** may represent a critical or high-probability region within the output set.
4. **Tail Extensions**: The points extend toward **y₁ = -10, y₂ = -10**, indicating the output set spans a wide range in the negative quadrant.
---
### Interpretation
- **Output Set Estimation**: The black points likely represent a set of possible outcomes or states generated by a system, with the irregular shape reflecting uncertainty or variability in the estimation process.
- **Unsafe Region**: The red square highlights a **critical boundary** where outcomes are deemed unsafe. Its placement in the top-right quadrant suggests that values in this region (e.g., high y₁ and low y₂) are excluded from the output set, possibly due to constraints or safety thresholds.
- **Dense Cluster**: The sub-cluster near **y₁ = 1, y₂ = 0** could indicate a **high-probability or stable region** within the output set, while the tail toward the negative quadrant may represent **edge cases or outliers**.
- **Spatial Relationships**: The separation between the unsafe region and the output set implies that the system avoids or excludes values in the red square, possibly through design or operational constraints.
---
### Notes on Data and Trends
- **No Numerical Data Provided**: The image does not include explicit numerical values for individual points, only approximate positions.
- **Trend Verification**: The black points show no clear linear or exponential trend, reinforcing the irregular, stochastic nature of the output set.
- **Anomalies**: The absence of points in the red square and the dense cluster near **y₁ = 1, y₂ = 0** are notable features requiring further investigation.
---
### Conclusion
This plot illustrates a system's output set estimation, avoiding a defined unsafe region. The irregular shape of the output set and the isolated unsafe region suggest a complex interplay between system behavior and safety constraints. Further analysis would benefit from quantitative data or additional context about the system's parameters.