## Line Chart: Model Accuracy vs. Thinking Compute
### Overview
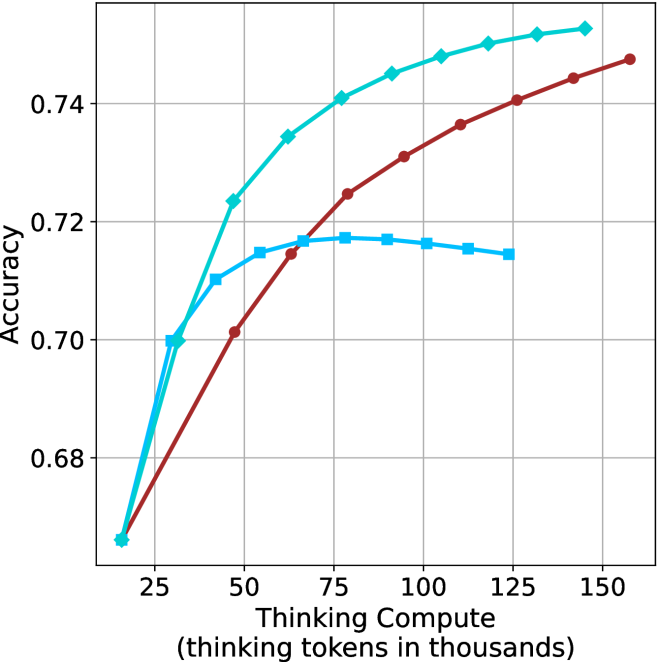
The chart illustrates the relationship between computational resources (thinking tokens in thousands) and model accuracy for three distinct models (A, B, and C). Accuracy is measured on a scale from 0.68 to 0.74, while thinking compute ranges from 25 to 150 thousand tokens.
### Components/Axes
- **X-axis**: "Thinking Compute (thinking tokens in thousands)" with markers at 25, 50, 75, 100, 125, and 150.
- **Y-axis**: "Accuracy" with markers at 0.68, 0.70, 0.72, and 0.74.
- **Legend**: Located in the top-right corner, associating:
- Teal line with "Model A"
- Red line with "Model B"
- Blue line with "Model C"
### Detailed Analysis
1. **Model A (Teal Line)**:
- Starts at **0.68 accuracy** when compute is 25k tokens.
- Increases steadily, reaching **0.74 accuracy** at 150k tokens.
- Shows a consistent upward trend with no plateaus or declines.
2. **Model B (Red Line)**:
- Begins at **0.68 accuracy** at 25k tokens.
- Rises sharply to **0.74 accuracy** by 100k tokens.
- Plateaus at 0.74 for compute levels above 100k tokens.
3. **Model C (Blue Line)**:
- Starts at **0.68 accuracy** at 25k tokens.
- Peaks at **0.72 accuracy** around 75k tokens.
- Declines slightly to **0.69 accuracy** at 150k tokens.
### Key Observations
- **Model B** achieves the highest accuracy (0.74) with the least compute (100k tokens), but performance stabilizes afterward.
- **Model C** exhibits a peak at 75k tokens, followed by a decline, suggesting potential inefficiency or overfitting at higher compute levels.
- **Model A** demonstrates the most linear and reliable improvement in accuracy with increasing compute.
### Interpretation
The data suggests that computational resources significantly impact model accuracy, but the relationship varies by model:
- **Model B** is highly efficient, achieving optimal performance with moderate compute, after which additional resources yield no benefit.
- **Model C** may suffer from diminishing returns or resource mismanagement, as its accuracy drops despite increased compute.
- **Model A** represents a balanced approach, showing steady gains without saturation, making it the most scalable option.
This analysis highlights trade-offs between compute efficiency and accuracy, emphasizing the importance of model-specific optimization strategies.