## Chart: LM Loss vs. PFLOP/s-days for MoBA and Full Attention Projections
### Overview
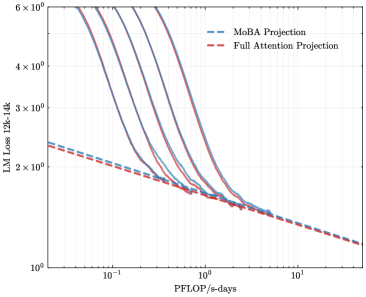
The image is a line chart comparing the Language Model (LM) Loss of MoBA Projection and Full Attention Projection models as a function of PFLOP/s-days. The y-axis represents LM Loss (12k-14k), and the x-axis represents PFLOP/s-days. Several lines are plotted for each projection type, showing the loss curves.
### Components/Axes
* **X-axis:** PFLOP/s-days (logarithmic scale from 10<sup>-1</sup> to 10<sup>1</sup>)
* **Y-axis:** LM Loss 12k-14k (logarithmic scale from 1x10<sup>0</sup> to 6x10<sup>0</sup>)
* **Legend (top-right):**
* Blue dashed line: MoBA Projection
* Red dashed line: Full Attention Projection
### Detailed Analysis
* **MoBA Projection (Blue lines):** There are multiple blue lines, each representing a different run or configuration of the MoBA Projection model. All the blue lines show a similar trend: a steep decrease in LM Loss as PFLOP/s-days increases from 0.1 to 1, followed by a more gradual decrease as PFLOP/s-days increases further.
* At PFLOP/s-days = 0.1, the LM Loss ranges from approximately 4x10<sup>0</sup> to 6x10<sup>0</sup>.
* At PFLOP/s-days = 1, the LM Loss ranges from approximately 1.5x10<sup>0</sup> to 2x10<sup>0</sup>.
* At PFLOP/s-days = 10, the LM Loss appears to be approaching a value around 1.5x10<sup>0</sup>.
* **Full Attention Projection (Red dashed line):** The red dashed line represents the Full Attention Projection model. It shows a consistent, gradual decrease in LM Loss as PFLOP/s-days increases.
* At PFLOP/s-days = 0.1, the LM Loss is approximately 2.2x10<sup>0</sup>.
* At PFLOP/s-days = 1, the LM Loss is approximately 1.5x10<sup>0</sup>.
* At PFLOP/s-days = 10, the LM Loss is approximately 1.2x10<sup>0</sup>.
### Key Observations
* The MoBA Projection models (blue lines) initially have a higher LM Loss than the Full Attention Projection model (red dashed line) at low PFLOP/s-days values.
* The MoBA Projection models experience a rapid decrease in LM Loss as PFLOP/s-days increases, converging towards the performance of the Full Attention Projection model.
* At higher PFLOP/s-days values (around 1 and above), the LM Loss of the MoBA Projection models becomes comparable to or slightly better than the Full Attention Projection model.
### Interpretation
The chart suggests that the MoBA Projection models require a certain amount of computational resources (PFLOP/s-days) to reach their optimal performance. Initially, they perform worse than the Full Attention Projection model, but with sufficient training, they can achieve comparable or even slightly better LM Loss. This indicates that MoBA Projection might be more computationally efficient in the long run, as it can achieve similar performance with potentially less computational overhead once it has been adequately trained. The multiple lines for MoBA likely represent different hyperparameter settings or random initializations, showing the variability in performance depending on these factors. The Full Attention model shows a more stable and predictable decrease in loss with increasing compute.