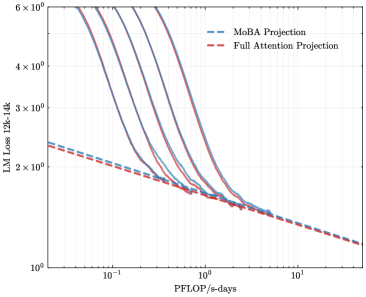
## Chart: LM Loss vs. PFLOP/s-days
### Overview
The image presents a line chart comparing the Language Model (LM) Loss for two different projection methods: MoBA Projection and Full Attention Projection, plotted against PFLOP/s-days (floating point operations per second-days). The chart displays multiple lines representing different runs or trials for each projection method, showing the loss reduction as computational cost increases. The y-axis is on a logarithmic scale.
### Components/Axes
* **X-axis:** PFLOP/s-days, ranging from approximately 10<sup>-1</sup> to 10<sup>1</sup> (0.1 to 10). The scale is logarithmic.
* **Y-axis:** LM Loss 12k-14k, ranging from approximately 10<sup>0</sup> to 6 x 10<sup>6</sup> (1 to 6,000,000). The scale is logarithmic.
* **Legend:** Located in the top-right corner.
* MoBA Projection (Blue dashed lines)
* Full Attention Projection (Red dashed lines)
* **Data Series:** Multiple lines for each projection method, showing variations in performance.
### Detailed Analysis
The chart shows several lines for each projection method. Let's analyze each:
**MoBA Projection (Blue dashed lines):**
* **Line 1:** Starts at approximately (0.1, 2.5 x 10<sup>5</sup>) and decreases to approximately (10, 2.0 x 10<sup>1</sup>). The line exhibits a steep initial decline, then gradually flattens.
* **Line 2:** Starts at approximately (0.1, 1.5 x 10<sup>5</sup>) and decreases to approximately (10, 1.5 x 10<sup>1</sup>). Similar trend to Line 1, but consistently lower loss values.
* **Line 3:** Starts at approximately (0.1, 1.2 x 10<sup>5</sup>) and decreases to approximately (10, 1.0 x 10<sup>1</sup>). Similar trend to Line 1 and 2, but consistently lower loss values.
**Full Attention Projection (Red dashed lines):**
* **Line 1:** Starts at approximately (0.1, 5.0 x 10<sup>5</sup>) and decreases to approximately (10, 2.5 x 10<sup>1</sup>). The line exhibits a steep initial decline, then gradually flattens.
* **Line 2:** Starts at approximately (0.1, 3.0 x 10<sup>5</sup>) and decreases to approximately (10, 2.0 x 10<sup>1</sup>). Similar trend to Line 1, but consistently lower loss values.
* **Line 3:** Starts at approximately (0.1, 2.0 x 10<sup>5</sup>) and decreases to approximately (10, 1.5 x 10<sup>1</sup>). Similar trend to Line 1 and 2, but consistently lower loss values.
All lines demonstrate a decreasing trend in LM Loss as PFLOP/s-days increases. The initial decrease is more pronounced at lower PFLOP/s-days values.
### Key Observations
* **Performance Comparison:** For a given PFLOP/s-days value, MoBA Projection consistently achieves lower LM Loss compared to Full Attention Projection.
* **Variability:** There is variability in performance within each projection method, as indicated by the multiple lines. This suggests that the results can vary depending on the specific run or initialization.
* **Diminishing Returns:** The rate of loss reduction decreases as PFLOP/s-days increases, indicating diminishing returns from further computational investment.
* **Logarithmic Scales:** The use of logarithmic scales on both axes emphasizes the large range of values and the relative changes in loss and computational cost.
### Interpretation
The chart demonstrates that MoBA Projection is more efficient than Full Attention Projection in terms of achieving lower LM Loss for a given computational cost (PFLOP/s-days). The multiple lines for each method suggest that the performance is not deterministic and can vary. The diminishing returns observed at higher PFLOP/s-days values indicate that there is a point beyond which increasing computational cost yields only marginal improvements in LM Loss. This information is valuable for optimizing the training process of language models, as it suggests that MoBA Projection is a more cost-effective approach, and that there is a trade-off between computational cost and model performance. The logarithmic scales suggest that the relationship between loss and computational cost is not linear, and that small changes in PFLOP/s-days can have a significant impact on loss, especially at lower values.