## Line Chart: SER vs. Pilot Size for Different Algorithms
### Overview
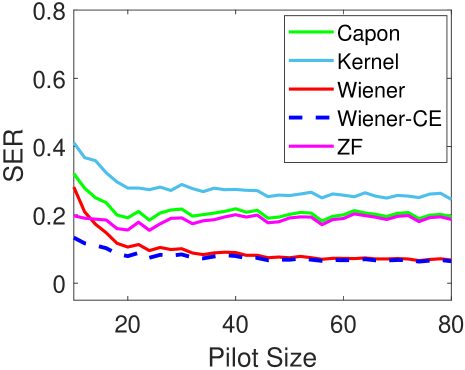
The image is a line chart comparing the Symbol Error Rate (SER) of five different algorithms (Capon, Kernel, Wiener, Wiener-CE, and ZF) as a function of Pilot Size. The x-axis represents the Pilot Size, ranging from approximately 0 to 80. The y-axis represents the SER, ranging from 0 to 0.8. Each algorithm is represented by a different colored line.
### Components/Axes
* **X-axis:** Pilot Size, ranging from 0 to 80 in increments of 20.
* **Y-axis:** SER (Symbol Error Rate), ranging from 0 to 0.8 in increments of 0.2.
* **Legend:** Located in the top-right corner, identifying each algorithm by color:
* Green: Capon
* Light Blue: Kernel
* Red: Wiener
* Dark Blue (dashed): Wiener-CE
* Magenta: ZF
### Detailed Analysis
* **Capon (Green):** The SER starts at approximately 0.35 at Pilot Size 5 and decreases to around 0.20, then remains relatively stable as the Pilot Size increases.
* Pilot Size 5: SER ≈ 0.35
* Pilot Size 80: SER ≈ 0.20
* **Kernel (Light Blue):** The SER starts at approximately 0.40 at Pilot Size 5 and decreases to around 0.25, then remains relatively stable as the Pilot Size increases.
* Pilot Size 5: SER ≈ 0.40
* Pilot Size 80: SER ≈ 0.25
* **Wiener (Red):** The SER starts at approximately 0.30 at Pilot Size 5 and decreases to around 0.07, then remains relatively stable as the Pilot Size increases.
* Pilot Size 5: SER ≈ 0.30
* Pilot Size 80: SER ≈ 0.07
* **Wiener-CE (Dark Blue, dashed):** The SER starts at approximately 0.15 at Pilot Size 5 and decreases to around 0.05, then remains relatively stable as the Pilot Size increases.
* Pilot Size 5: SER ≈ 0.15
* Pilot Size 80: SER ≈ 0.05
* **ZF (Magenta):** The SER starts at approximately 0.22 at Pilot Size 5 and decreases to around 0.18, then remains relatively stable as the Pilot Size increases.
* Pilot Size 5: SER ≈ 0.22
* Pilot Size 80: SER ≈ 0.18
### Key Observations
* All algorithms show a decrease in SER as the Pilot Size increases initially.
* The Wiener-CE algorithm (dark blue, dashed line) consistently has the lowest SER across all Pilot Sizes.
* The Kernel algorithm (light blue line) consistently has the highest SER across all Pilot Sizes.
* The SER for all algorithms stabilizes after a Pilot Size of approximately 40.
### Interpretation
The chart demonstrates the relationship between Pilot Size and Symbol Error Rate for different signal processing algorithms. The initial decrease in SER with increasing Pilot Size suggests that larger pilot sizes improve the accuracy of signal estimation, up to a point. The stabilization of SER after a certain Pilot Size indicates a diminishing return on increasing the Pilot Size further. The Wiener-CE algorithm appears to be the most effective in minimizing SER, while the Kernel algorithm is the least effective among those compared. The choice of algorithm and Pilot Size would depend on the specific application and the trade-off between performance and resource utilization.