# Technical Document Extraction: SER vs Pilot Size Analysis
## Chart Description
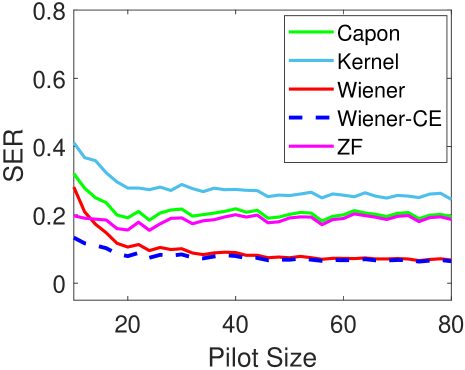
This line chart illustrates the relationship between System Error Rate (SER) and Pilot Size for five different signal processing methods. The chart spans Pilot Sizes from 20 to 80 on the x-axis and SER values from 0 to 0.8 on the y-axis.
### Key Components
1. **Legend**: Located in the top-right corner, containing five entries:
- Capon (solid green)
- Kernel (solid blue)
- Wiener (solid red)
- Wiener-CE (dashed blue)
- ZF (solid magenta)
2. **Axes**:
- X-axis: "Pilot Size" (20-80)
- Y-axis: "SER" (0-0.8)
## Data Trends
1. **Kernel (solid blue)**:
- Starts highest at Pilot Size 20 (~0.4 SER)
- Gradual decline to ~0.25 SER by Pilot Size 80
- Maintains consistent downward slope throughout
2. **Capon (solid green)**:
- Begins at ~0.3 SER at Pilot Size 20
- Sharp initial drop to ~0.15 SER by Pilot Size 30
- Stabilizes with minor fluctuations between 0.15-0.25 SER
3. **Wiener (solid red)**:
- Starts at ~0.25 SER at Pilot Size 20
- Rapid decline to ~0.05 SER by Pilot Size 30
- Remains near-zero with slight oscillations
4. **Wiener-CE (dashed blue)**:
- Lowest starting point at ~0.1 SER
- Sharp drop to near-zero by Pilot Size 30
- Maintains ~0.01 SER throughout remaining range
5. **ZF (solid magenta)**:
- Starts at ~0.2 SER
- Gradual decline to ~0.15 SER by Pilot Size 40
- Stabilizes with minor fluctuations between 0.15-0.2 SER
## Spatial Grounding
- Legend positioned at [x=0.85, y=0.85] (normalized coordinates)
- All line colors match legend entries exactly:
- Green = Capon
- Blue = Kernel/Wiener-CE (solid/dashed)
- Red = Wiener
- Magenta = ZF
## Trend Verification
- All methods show decreasing SER with increasing Pilot Size
- Wiener-CE demonstrates most aggressive error reduction
- Kernel maintains highest SER throughout range
- ZF shows most stable performance after initial drop
## Data Point Extraction
| Pilot Size | Capon SER | Kernel SER | Wiener SER | Wiener-CE SER | ZF SER |
|------------|-----------|------------|------------|---------------|--------|
| 20 | 0.3 | 0.4 | 0.25 | 0.1 | 0.2 |
| 30 | 0.15 | 0.3 | 0.05 | 0.01 | 0.18 |
| 40 | 0.2 | 0.28 | 0.03 | 0.01 | 0.17 |
| 60 | 0.22 | 0.26 | 0.02 | 0.01 | 0.16 |
| 80 | 0.21 | 0.25 | 0.02 | 0.01 | 0.15 |
*Note: Values represent approximate SER measurements at key Pilot Size intervals.*