## Graph Transformation Diagram: BFS-Tree Construction
### Overview
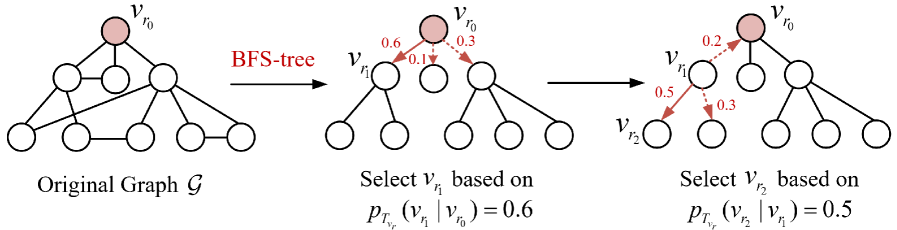
The image illustrates the transformation of an original graph into a BFS-tree through a series of node selections based on conditional probabilities. The diagram shows the initial graph and two subsequent stages of tree construction, highlighting the selection process with probability values assigned to potential edges.
### Components/Axes
* **Nodes:** Represented as circles, some filled with a light red color to indicate selected nodes.
* **Edges:** Solid lines represent existing connections in the graph or tree. Dashed red lines indicate potential edges with associated probabilities.
* **Labels:**
* `Original Graph G`: Label for the initial graph on the left.
* `BFS-tree`: Text indicating the transformation process.
* `Select v₁ based on pTvr(v₁ | vr₀) = 0.6`: Label for the middle graph, indicating the selection of node v₁ based on the given conditional probability.
* `Select v₂ based on pTvr(v₂ | vr₁) = 0.5`: Label for the rightmost graph, indicating the selection of node v₂ based on the given conditional probability.
* `vr₀`, `vr₁`, `vr₂`: Node labels.
### Detailed Analysis
**1. Original Graph G (Left)**
* A complex graph with approximately 10 nodes and multiple edges.
* One node, labeled `vr₀`, is highlighted in light red.
**2. BFS-tree Transformation (Middle)**
* The graph is transformed into a tree structure.
* Node `vr₀` (light red) is the root.
* Node `vr₁` is selected based on the conditional probability `pTvr(v₁ | vr₀) = 0.6`.
* Probabilities are assigned to potential edges from `vr₀`:
* Edge to `vr₁`: 0.6 (solid red arrow)
* Two other potential edges (dashed red arrows) with probabilities 0.1 and 0.3.
**3. Further BFS-tree Construction (Right)**
* The tree structure is further developed.
* Node `vr₂` is selected based on the conditional probability `pTvr(v₂ | vr₁) = 0.5`.
* Probabilities are assigned to potential edges from `vr₁`:
* Edge to `vr₂`: 0.5 (solid red arrow)
* Two other potential edges (dashed red arrows) with probabilities 0.2 and 0.3.
### Key Observations
* The diagram illustrates a step-by-step process of building a BFS-tree from an original graph.
* Node selection is based on conditional probabilities, influencing the tree's structure.
* The probabilities associated with potential edges suggest a probabilistic approach to tree construction.
### Interpretation
The diagram demonstrates a method for constructing a Breadth-First Search (BFS) tree from an arbitrary graph. The process involves selecting nodes based on conditional probabilities, which likely represent the likelihood of traversing from one node to another in the original graph. The probabilities guide the formation of the tree, potentially optimizing for certain criteria or reflecting underlying relationships within the original graph structure. The use of conditional probabilities suggests a stochastic or weighted approach to BFS tree construction, deviating from the standard deterministic algorithm. The values 0.6 and 0.5 represent the probabilities of selecting `v₁` given `v₀` and `v₂` given `v₁` respectively, indicating a preference or higher likelihood for those specific connections during the tree-building process.