# Technical Document Extraction: Graph Transformation and Node Selection Process
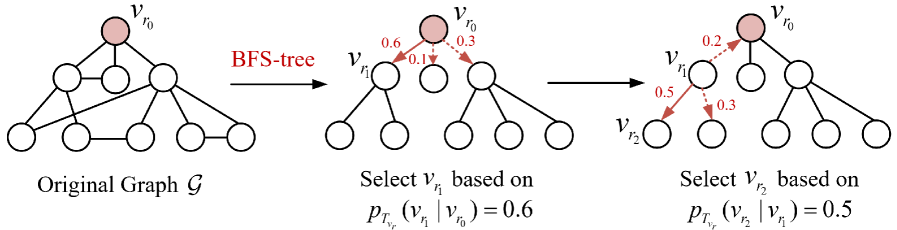
This image illustrates a three-stage technical process involving graph theory, specifically the conversion of a general graph into a Breadth-First Search (BFS) tree and the subsequent probabilistic selection of nodes.
## 1. Component Isolation
The image is divided into three distinct horizontal segments representing a sequential workflow from left to right.
### Region 1: Original Graph Structure
* **Label:** "Original Graph $\mathcal{G}$"
* **Components:** A non-directed graph consisting of 10 nodes.
* **Root Node:** The top-most node is highlighted in pink and labeled $v_{r_0}$.
* **Topology:** The graph contains multiple cycles and cross-layer edges. It has a hierarchical layout but is not yet a tree.
### Region 2: BFS-tree Transformation and First Selection
* **Transition:** An arrow labeled "**BFS-tree**" (in dark red text) indicates the transformation from the original graph.
* **Structure:** The graph has been pruned into a tree structure rooted at $v_{r_0}$.
* **Probabilistic Edges:** Three directed red arrows originate from $v_{r_0}$ to its immediate children, each with an associated numerical value:
* Solid arrow to the left child ($v_{r_1}$): **0.6**
* Dashed arrow to the center child: **0.1**
* Dashed arrow to the right child: **0.3**
* **Selection Label:** "Select $v_{r_1}$ based on $p_{T_{v_r}}(v_{r_1} | v_{r_0}) = 0.6$"
* **Analysis:** The node $v_{r_1}$ is selected because it has the highest conditional probability (0.6) among the children of the root.
### Region 3: Subsequent Node Selection
* **Transition:** A plain black arrow indicates the progression to the next level of selection.
* **Structure:** The BFS-tree structure is maintained.
* **Probabilistic Edges from $v_{r_1}$:** Two directed red arrows originate from the previously selected node $v_{r_1}$ to its children:
* Solid arrow to the leftmost child ($v_{r_2}$): **0.5**
* Dashed arrow to the right child: **0.3**
* **Back-reference Edge:** A dashed red arrow points from $v_{r_1}$ back to $v_{r_0}$ with a value of **0.2**.
* **Selection Label:** "Select $v_{r_2}$ based on $p_{T_{v_r}}(v_{r_2} | v_{r_1}) = 0.5$"
* **Analysis:** The node $v_{r_2}$ is selected from the children of $v_{r_1}$ based on the highest probability (0.5). Note that the sum of probabilities from $v_{r_1}$ (0.5 + 0.3 + 0.2) equals 1.0.
---
## 2. Data Summary and Mathematical Notations
### Node Identifiers
| Symbol | Description |
| :--- | :--- |
| $v_{r_0}$ | The initial root node (Pink). |
| $v_{r_1}$ | The first selected child node. |
| $v_{r_2}$ | The second selected child node (grandchild of $v_{r_0}$). |
### Probability Distributions
The selection process follows a conditional probability path:
1. **Level 1 Selection:**
* $P(v_{r_1} | v_{r_0}) = 0.6$ (Selected)
* $P(\text{center child} | v_{r_0}) = 0.1$
* $P(\text{right child} | v_{r_0}) = 0.3$
* **Sum = 1.0**
2. **Level 2 Selection (from $v_{r_1}$):**
* $P(v_{r_2} | v_{r_1}) = 0.5$ (Selected)
* $P(\text{sibling of } v_{r_2} | v_{r_1}) = 0.3$
* $P(v_{r_0} | v_{r_1}) = 0.2$ (Probability of moving back to parent)
* **Sum = 1.0**
## 3. Visual Trends and Logic Check
* **Trend:** The process moves downward through the hierarchy of the BFS-tree.
* **Visual Logic:** Solid red arrows represent the chosen path based on the highest numerical value, while dashed red arrows represent alternative paths with lower probabilities.
* **Consistency:** The total probability exiting any selected node sums to 1.0, confirming a valid probability distribution for the selection step.