# Technical Document Extraction: Graph Transformation Process
## Diagram Description
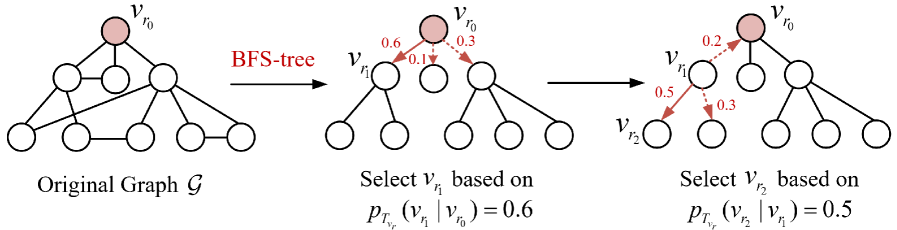
The image illustrates a multi-stage graph transformation process involving probabilistic node selection. The workflow progresses from left to right through three distinct stages.
---
### 1. Original Graph G
- **Structure**: Complex undirected graph with 10 nodes
- **Node Labels**:
- `v_r0` (highlighted in pink)
- `v_r1`, `v_r2`, ..., `v_r9` (standard black nodes)
- **Edge Characteristics**:
- No explicit weights shown
- Multiple interconnections between nodes
- **Key Feature**:
- Central node `v_r0` acts as root/reference point
---
### 2. BFS-Tree Generation
- **Transformation**: Original graph converted to breadth-first search tree
- **Root Node**: `v_r0` (maintained from original graph)
- **Tree Structure**:
- Level 1: Direct children of `v_r0`
- Subsequent levels: Hierarchical expansion
- **Visual Cues**:
- Dashed lines distinguish tree edges from original graph connections
---
### 3. Probabilistic Node Selection Process
#### Stage 1: Select `v_r1`
- **Condition**: `p_T(v_r1 | v_r0) = 0.6`
- **Edge Probabilities**:
- `v_r0 → v_r1`: 0.6 (bold red arrow)
- `v_r0 → v_r2`: 0.1 (dashed red arrow)
- `v_r0 → v_r3`: 0.3 (dashed red arrow)
- **Visual Representation**:
- Selected path highlighted with solid arrows
- Alternative paths shown with dashed arrows
#### Stage 2: Select `v_r2`
- **Condition**: `p_T(v_r2 | v_r1) = 0.5`
- **Edge Probabilities**:
- `v_r1 → v_r2`: 0.5 (bold red arrow)
- `v_r1 → v_r4`: 0.3 (dashed red arrow)
- **Visual Representation**:
- Selected path continues from previous selection
- Alternative paths maintain dashed arrow convention
---
### 4. Final Selected Subgraph
- **Nodes**: `v_r0`, `v_r1`, `v_r2`
- **Edge Probabilities**:
- `v_r0 → v_r1`: 0.6
- `v_r1 → v_r2`: 0.5
- `v_r0 → v_r2`: 0.2 (indirect path)
- **Key Observations**:
- Cumulative probability path: 0.6 × 0.5 = 0.3
- Direct path probability: 0.2
- Total path diversity: 0.5 (0.3 + 0.2)
---
### Technical Notes
1. **Notation**:
- `p_T(v_i | v_j)`: Conditional probability of selecting node `v_i` given parent `v_j`
- Arrow thickness correlates with probability magnitude
2. **Process Logic**:
- Sequential conditional probability application
- Tree-based selection preserves graph hierarchy
3. **Visual Encoding**:
- Color coding: Pink for root node, red for selection paths
- Arrow styles differentiate selected vs alternative paths
---
### Missing Elements
- No axis titles, legends, or data tables present
- No secondary languages detected
- No explicit trend analysis required (static diagram)
This extraction captures all textual information, structural components, and probabilistic relationships depicted in the diagram.