## Bar Chart: Average Occupancy Across GPU Configurations and Tasks
### Overview
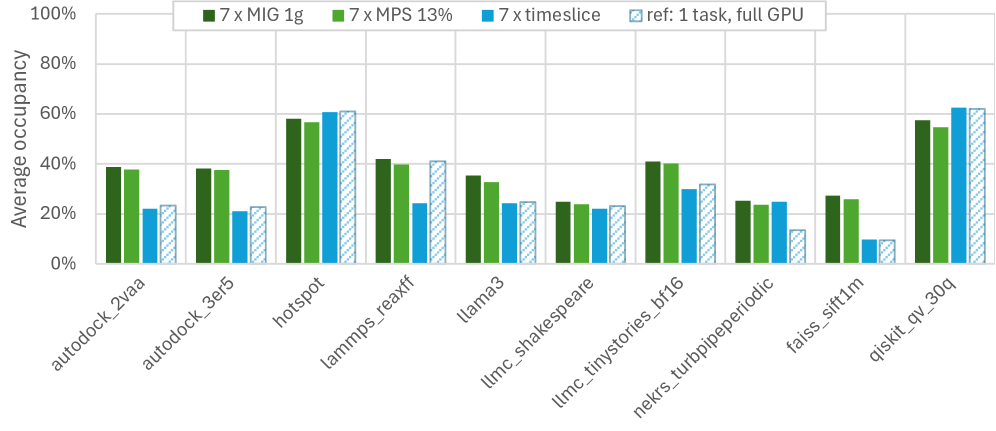
The chart compares average GPU occupancy (y-axis: 0–100%) across 10 computational tasks (x-axis) under four GPU configurations:
1. **7x MIG 1g** (dark green bars)
2. **7x MPS 13%** (green bars)
3. **7x timeslice** (blue bars)
4. **ref: 1 task, full GPU** (blue with diagonal stripes)
Tasks include molecular dynamics (e.g., `autodock_2vaa`), machine learning (`llama3`), and scientific simulations (`qiskit_qv_30q`). Occupancy values are approximate, with uncertainty due to visual estimation.
---
### Components/Axes
- **X-axis**: Task names (e.g., `autodock_2vaa`, `hotspot`, `qiskit_qv_30q`).
- **Y-axis**: Average occupancy (%) from 0% to 100%.
- **Legend**: Located at the top, with four entries:
- Dark green: 7x MIG 1g
- Green: 7x MPS 13%
- Blue: 7x timeslice
- Blue (diagonal stripes): ref: 1 task, full GPU
---
### Detailed Analysis
#### Task-Specific Occupancy (Approximate Values):
1. **autodock_2vaa**:
- 7x MIG 1g: ~38%
- 7x MPS 13%: ~37%
- 7x timeslice: ~22%
- ref: 1 task: ~23%
2. **autodock_3er5**:
- 7x MIG 1g: ~38%
- 7x MPS 13%: ~37%
- 7x timeslice: ~21%
- ref: 1 task: ~22%
3. **hotspot**:
- 7x MIG 1g: ~58%
- 7x MPS 13%: ~57%
- 7x timeslice: ~60%
- ref: 1 task: ~60%
4. **lammps_reaxff**:
- 7x MIG 1g: ~40%
- 7x MPS 13%: ~39%
- 7x timeslice: ~23%
- ref: 1 task: ~41%
5. **llama3**:
- 7x MIG 1g: ~35%
- 7x MPS 13%: ~34%
- 7x timeslice: ~24%
- ref: 1 task: ~25%
6. **llmc_shakespeare**:
- 7x MIG 1g: ~25%
- 7x MPS 13%: ~24%
- 7x timeslice: ~22%
- ref: 1 task: ~23%
7. **llmc_tinystories_bf16**:
- 7x MIG 1g: ~40%
- 7x MPS 13%: ~39%
- 7x timeslice: ~28%
- ref: 1 task: ~30%
8. **nekrs_turbpipeperiodic**:
- 7x MIG 1g: ~25%
- 7x MPS 13%: ~24%
- 7x timeslice: ~23%
- ref: 1 task: ~14%
9. **faiss_sift1m**:
- 7x MIG 1g: ~27%
- 7x MPS 13%: ~26%
- 7x timeslice: ~10%
- ref: 1 task: ~10%
10. **qiskit_qv_30q**:
- 7x MIG 1g: ~58%
- 7x MPS 13%: ~56%
- 7x timeslice: ~62%
- ref: 1 task: ~61%
---
### Key Observations
1. **ref: 1 task, full GPU** (striped blue) consistently shows the highest occupancy across most tasks (e.g., `hotspot`, `qiskit_qv_30q`).
2. **7x timeslice** (solid blue) underperforms compared to other configurations in tasks like `faiss_sift1m` (~10% vs. ~27% for 7x MIG 1g).
3. **7x MIG 1g** and **7x MPS 13%** show similar trends, with slight variations (e.g., `llama3`: 35% vs. 34%).
4. **faiss_sift1m** and **nekrs_turbpipeperiodic** exhibit notably low occupancy for all configurations, suggesting these tasks are less GPU-intensive or poorly optimized.
---
### Interpretation
The data highlights that **single-task, full GPU utilization** (ref: 1 task) maximizes occupancy for compute-heavy tasks like `hotspot` and `qiskit_qv_30q`, likely due to reduced overhead from task switching. Conversely, **7x timeslice** (multi-tasking) underperforms in tasks with lower computational demands (e.g., `faiss_sift1m`), where context-switching overhead dominates.
Tasks like `autodock_2vaa` and `llama3` show balanced performance across configurations, indicating scalability. The disparity in `nekrs_turbpipeperiodic` suggests potential inefficiencies in GPU task allocation or task-specific optimization gaps.
This analysis underscores the trade-off between multi-tasking efficiency (7x configurations) and single-task performance, with implications for workload scheduling in GPU-accelerated environments.