\n
## Diagram: Cognitive Process Flow for Percentage Calculation
### Overview
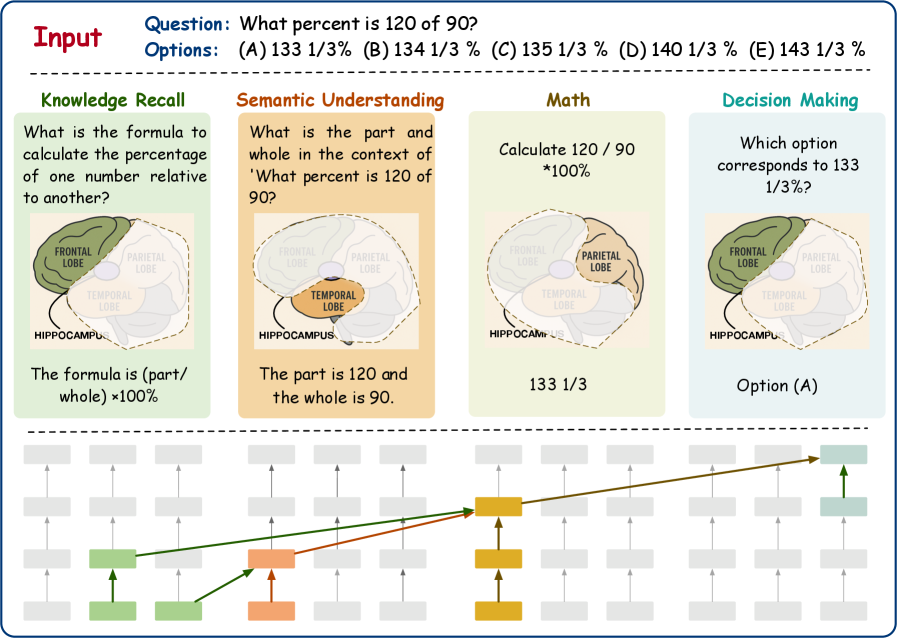
This diagram illustrates a cognitive process flow for solving the percentage problem: "What percent is 120 of 90?". It breaks down the problem-solving into four stages: Knowledge Recall, Semantic Understanding, Math, and Decision Making. Each stage is associated with a brain region visualization and a corresponding step in the calculation. A flow diagram at the bottom visually represents the information transfer between these stages.
### Components/Axes
The diagram is structured into four columns, each representing a cognitive stage. Each column contains:
* **Stage Title:** (Knowledge Recall, Semantic Understanding, Math, Decision Making) – positioned at the top of each column.
* **Question/Task:** A textual description of the task performed in that stage.
* **Brain Region Visualization:** A simplified diagram of the brain highlighting specific lobes (Frontal, Parietal, Temporal, Hippocampus).
* **Result/Output:** The outcome of the stage, presented as text.
* **Arrows:** Green arrows at the bottom of the diagram indicate the flow of information between stages.
The top of the diagram includes the original problem:
* **Input Question:** "What percent is 120 of 90?"
* **Options:** (A) 133 1/3 %, (B) 134 1/3 %, (C) 135 1/3 %, (D) 140 1/3 %, (E) 143 1/3 %
### Detailed Analysis or Content Details
Let's analyze each stage:
1. **Knowledge Recall:**
* Question: "What is the formula to calculate the percentage of one number relative to another?"
* Brain Region: Brain diagram with all lobes visible.
* Output: "The formula is (part/whole) *100%"
2. **Semantic Understanding:**
* Question: "What is the part and whole in the context of 'What percent is 120 of 90?'"
* Brain Region: Brain diagram with all lobes visible.
* Output: "The part is 120 and the whole is 90."
3. **Math:**
* Question: "Calculate 120 / 90 *100%"
* Brain Region: Brain diagram with all lobes visible.
* Output: "133 1/3"
4. **Decision Making:**
* Question: "Which option corresponds to 133 1/3%?"
* Brain Region: Brain diagram with all lobes visible.
* Output: "Option (A)"
**Flow Diagram:**
The flow diagram at the bottom shows the following connections:
* A single input arrow enters the "Knowledge Recall" stage.
* An arrow flows from "Knowledge Recall" to "Semantic Understanding".
* An arrow flows from "Semantic Understanding" to "Math".
* An arrow flows from "Math" to "Decision Making".
* An output arrow exits the "Decision Making" stage.
* There are also smaller upward arrows within each stage, possibly representing internal processing.
### Key Observations
* The diagram clearly illustrates a sequential cognitive process.
* Each stage builds upon the previous one, leading to the final answer.
* The brain region visualizations are consistent across all stages, suggesting that multiple brain areas are involved in each step.
* The flow diagram emphasizes the linear progression of information.
### Interpretation
This diagram demonstrates a model of how a human might solve a percentage problem. It breaks down the process into distinct cognitive stages, highlighting the knowledge, understanding, calculation, and decision-making components. The use of brain region visualizations suggests that these stages are associated with specific neural processes. The diagram implies a relatively straightforward, linear flow of information, although the internal arrows within each stage suggest some level of internal processing and feedback. The diagram is a simplified representation of a complex cognitive process, but it provides a useful framework for understanding how humans approach and solve mathematical problems. The diagram does not provide any data points or numerical trends, but rather illustrates a conceptual model.