\n
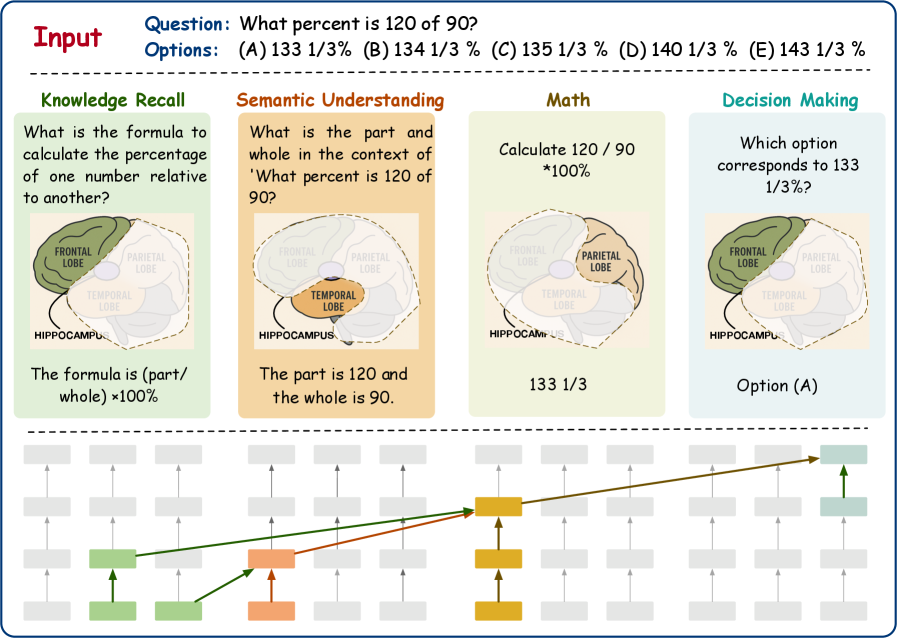
## Cognitive Process Diagram: Solving a Percentage Problem
### Overview
The image is a technical diagram illustrating the cognitive steps involved in solving a specific math problem: "What percent is 120 of 90?" It breaks down the problem-solving process into four distinct stages, each associated with a different cognitive function and a corresponding brain region. A flowchart at the bottom visualizes the information flow between these stages.
### Components/Axes
The diagram is organized into three main horizontal sections:
1. **Header (Top):** Contains the input problem and multiple-choice options.
* **Input Label:** "Input" (in red, top-left).
* **Question:** "Question: What percent is 120 of 90?"
* **Options:** "Options: (A) 133 1/3 % (B) 134 1/3 % (C) 135 1/3 % (D) 140 1/3 % (E) 143 1/3 %"
2. **Main Chart (Center):** Four vertical columns, each representing a cognitive stage. Each column contains:
* A **Stage Title** (e.g., "Knowledge Recall").
* A **Guiding Question** or instruction.
* A **Brain Diagram** with labeled lobes (FRONTAL LOBE, PARIETAL LOBE, TEMPORAL LOBE, HIPPOCAMPUS). One lobe is highlighted in each diagram.
* A **Resulting Statement or Answer** for that stage.
3. **Footer (Bottom):** A flowchart composed of colored rectangular boxes and directional arrows, illustrating the flow of information or processing between the stages.
### Detailed Analysis
**The Four Cognitive Stages (Left to Right):**
1. **Knowledge Recall (Green Column):**
* **Guiding Question:** "What is the formula to calculate the percentage of one number relative to another?"
* **Brain Highlight:** The **FRONTAL LOBE** is highlighted in green.
* **Result:** "The formula is (part/whole) ×100%"
2. **Semantic Understanding (Orange Column):**
* **Guiding Question:** "What is the part and whole in the context of 'What percent is 120 of 90?'"
* **Brain Highlight:** The **TEMPORAL LOBE** is highlighted in orange.
* **Result:** "The part is 120 and the whole is 90."
3. **Math (Yellow Column):**
* **Instruction:** "Calculate 120 / 90 *100%"
* **Brain Highlight:** The **PARIETAL LOBE** is highlighted in yellow.
* **Result:** "133 1/3"
4. **Decision Making (Teal Column):**
* **Guiding Question:** "Which option corresponds to 133 1/3%?"
* **Brain Highlight:** The **FRONTAL LOBE** is highlighted in teal.
* **Result:** "Option (A)"
**Flowchart Analysis (Bottom Section):**
* The flowchart consists of multiple rows of grey boxes, with specific boxes colored to correspond to the stages above.
* **Green boxes** (bottom-left) originate from the "Knowledge Recall" stage.
* **Orange boxes** (center-left) originate from the "Semantic Understanding" stage.
* **Yellow boxes** (center) originate from the "Math" stage.
* **Teal boxes** (top-right) originate from the "Decision Making" stage.
* **Arrows:** A series of arrows show the flow:
* Green arrows flow from the green boxes upward and rightward.
* An orange arrow flows from an orange box to a central yellow box.
* A yellow arrow flows from the yellow box upward to a teal box.
* A final green arrow points to the final teal box on the far right.
* This visualizes a sequential process where outputs from earlier stages (Recall, Understanding) feed into the Math stage, which then informs the final Decision Making stage.
### Key Observations
* **Process Decomposition:** The complex task of solving a word problem is explicitly decomposed into four linear, dependent sub-tasks.
* **Neuroscience Analogy:** Each cognitive stage is mapped to a simplified model of brain function, suggesting which region might be primarily engaged (e.g., Temporal Lobe for semantic meaning, Parietal Lobe for calculation).
* **Color Consistency:** A strict color code (Green, Orange, Yellow, Teal) is maintained across the stage columns and the corresponding boxes in the flowchart, providing clear visual linkage.
* **Spatial Layout:** The stages are arranged left-to-right in the order they are performed. The flowchart below uses a more complex, network-like layout but maintains the left-to-right overall progression.
### Interpretation
This diagram serves as a pedagogical or analytical model for understanding the multi-step nature of mathematical problem-solving. It demonstrates that answering a seemingly simple question requires distinct cognitive operations: retrieving relevant knowledge (formula), parsing language to assign values (semantic understanding), performing arithmetic (math), and matching a result to given choices (decision-making).
The inclusion of brain regions, while simplified, emphasizes that different neural networks are recruited for different types of thinking. The flowchart reinforces the idea that these processes are not isolated; information flows and builds upon itself. The final output (Option A) is the result of a chain of successful cognitive operations, any failure in which (e.g., recalling the wrong formula or misidentifying the 'part') would lead to an incorrect answer. The diagram effectively makes the "black box" of thinking visible and structured.