## Bar Chart: Accuracy Comparison
### Overview
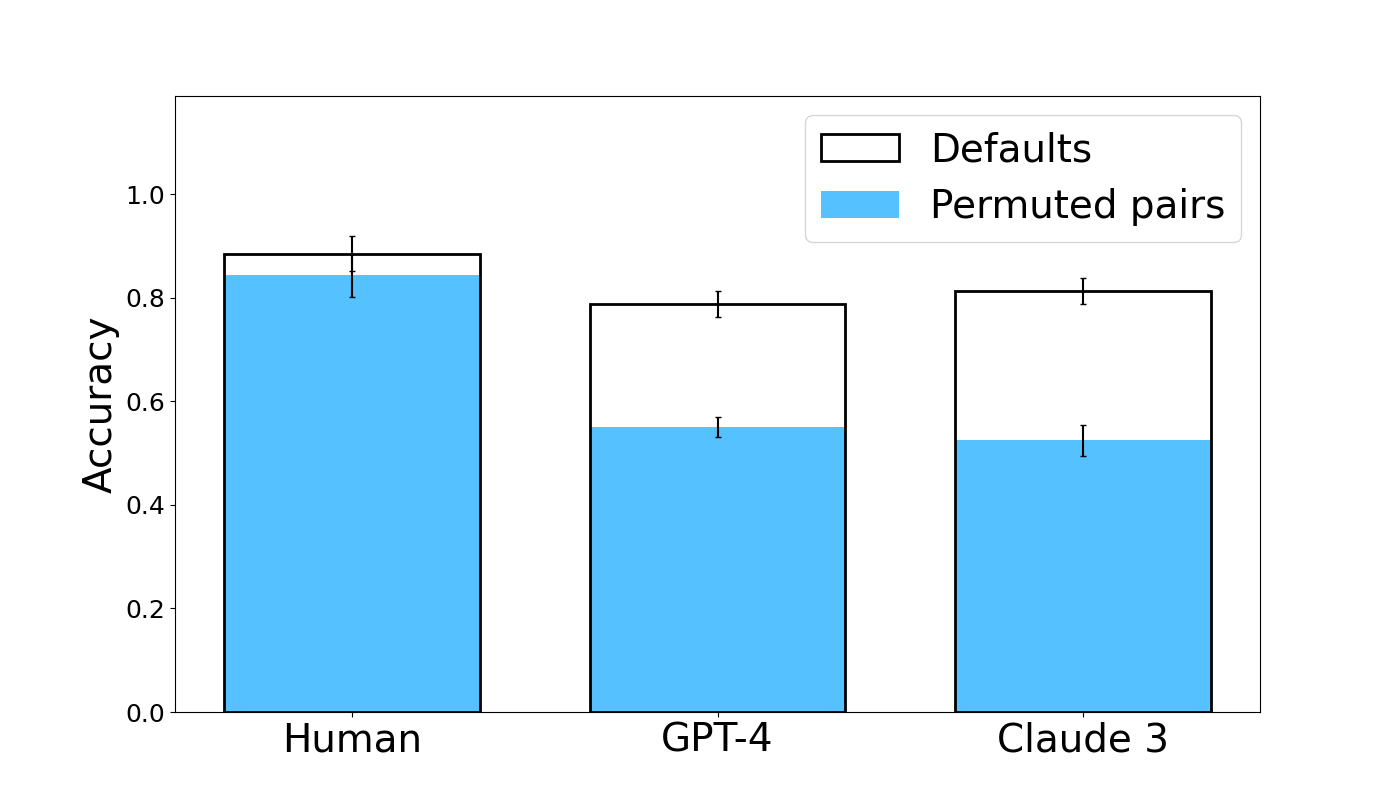
The image is a bar chart comparing the accuracy of "Defaults" and "Permuted pairs" across three categories: Human, GPT-4, and Claude 3. The chart displays accuracy on the y-axis, ranging from 0.0 to 1.0. Each category (Human, GPT-4, Claude 3) has two bars stacked on top of each other, representing "Permuted pairs" (bottom, light blue) and "Defaults" (top, white with black outline). Error bars are present on each stacked bar.
### Components/Axes
* **Y-axis:** "Accuracy", ranging from 0.0 to 1.0 in increments of 0.2.
* **X-axis:** Categorical labels: "Human", "GPT-4", and "Claude 3".
* **Legend (Top-Right):**
* "Defaults" (white bar with black outline)
* "Permuted pairs" (light blue bar)
### Detailed Analysis
* **Human:**
* "Permuted pairs" accuracy: approximately 0.84 with an error bar extending roughly +/- 0.04.
* "Defaults" accuracy: approximately 0.05 (the remaining portion of the bar to reach the top) with an error bar extending roughly +/- 0.04.
* **GPT-4:**
* "Permuted pairs" accuracy: approximately 0.55 with an error bar extending roughly +/- 0.04.
* "Defaults" accuracy: approximately 0.24 (the remaining portion of the bar to reach the top) with an error bar extending roughly +/- 0.04.
* **Claude 3:**
* "Permuted pairs" accuracy: approximately 0.53 with an error bar extending roughly +/- 0.04.
* "Defaults" accuracy: approximately 0.29 (the remaining portion of the bar to reach the top) with an error bar extending roughly +/- 0.04.
### Key Observations
* Human performance with "Permuted pairs" is significantly higher than GPT-4 and Claude 3.
* The "Defaults" accuracy is higher for Claude 3 than GPT-4 and Human.
* The error bars appear to be of similar magnitude across all categories and conditions.
### Interpretation
The chart suggests that humans are better at handling "Permuted pairs" compared to the AI models GPT-4 and Claude 3. The "Defaults" accuracy indicates the baseline performance without permutation. The difference in performance between "Defaults" and "Permuted pairs" highlights the impact of permutation on each category. The error bars provide a visual representation of the uncertainty or variability in the accuracy measurements.