## Line Chart: Time Steps to Solution vs. Problem Size and Parameter k
### Overview
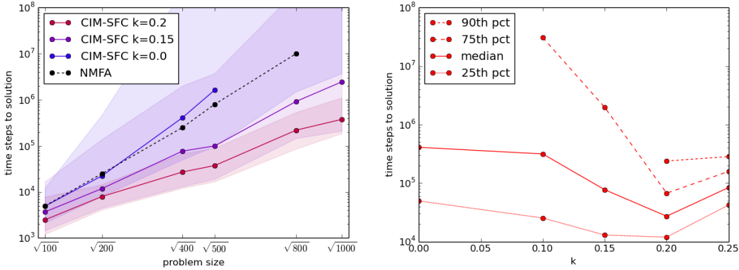
The image contains two line charts comparing computational performance metrics across different problem sizes and parameter values. The left panel shows time steps to solution as a function of problem size for various algorithms, while the right panel displays time steps as a function of parameter k for percentile-based performance distributions.
### Components/Axes
**Left Panel:**
- **X-axis (Problem Size):** Logarithmic scale from √100 to √1000 (10 to 31.62 units)
- **Y-axis (Time Steps to Solution):** Logarithmic scale from 10³ to 10⁸
- **Legend (Top-left):**
- CIM-SFC k=0.2 (magenta circles)
- CIM-SFC k=0.15 (purple circles)
- CIM-SFC k=0.0 (blue circles)
- NMFA (black dashed line with dots)
- **Shaded Regions:** Confidence intervals around each line
**Right Panel:**
- **X-axis (k):** Linear scale from 0.00 to 0.25
- **Y-axis (Time Steps to Solution):** Logarithmic scale from 10⁴ to 10⁸
- **Legend (Top-right):**
- 90th percentile (solid red line)
- 75th percentile (dashed red line)
- Median (dotted red line)
- 25th percentile (dash-dot red line)
### Detailed Analysis
**Left Panel Trends:**
1. **CIM-SFC k=0.2:** Starts at ~10³.5 steps at √100, rises to ~10⁵.5 at √1000 (magenta)
2. **CIM-SFC k=0.15:** Starts at ~10³.8, rises to ~10⁶ at √1000 (purple)
3. **CIM-SFC k=0.0:** Starts at ~10⁴, rises to ~10⁷ at √1000 (blue)
4. **NMFA:** Starts at ~10⁴, rises to ~10⁷.5 at √1000 (black dashed)
- All lines show positive correlation between problem size and time steps
- Confidence intervals widen with increasing problem size
**Right Panel Trends:**
- **90th percentile:** Starts at ~10⁷ at k=0.05, drops to ~10⁵ at k=0.15, then rises to ~10⁶ at k=0.25
- **75th percentile:** Starts at ~10⁶, drops to ~10⁴.5, then rises to ~10⁵.5
- **Median:** Starts at ~10⁵, drops to ~10⁴, then rises to ~10⁴.5
- **25th percentile:** Starts at ~10⁴, drops to ~10³.5, then rises to ~10⁴
### Key Observations
1. **Algorithm Efficiency:** CIM-SFC with lower k values consistently outperforms NMFA across all problem sizes
2. **Scalability:** Time steps increase exponentially with problem size for all algorithms
3. **Parameter Sensitivity:** Right panel shows non-linear relationship between k and performance, with significant variance in upper percentiles
4. **Confidence Intervals:** Left panel shaded regions indicate increasing uncertainty with larger problem sizes
### Interpretation
The data demonstrates that CIM-SFC algorithms with smaller k values (0.0-0.15) achieve better performance than NMFA, particularly at larger problem sizes. The right panel reveals that while median performance improves with increasing k, the 90th percentile shows a U-shaped pattern, suggesting some instances become significantly slower at extreme k values. This indicates that while average performance may improve with parameter tuning, there's a risk of outliers degrading results. The exponential scaling of time steps with problem size highlights the need for algorithmic optimizations to handle larger datasets efficiently.