## Scatter Plot: Genre Distribution
### Overview
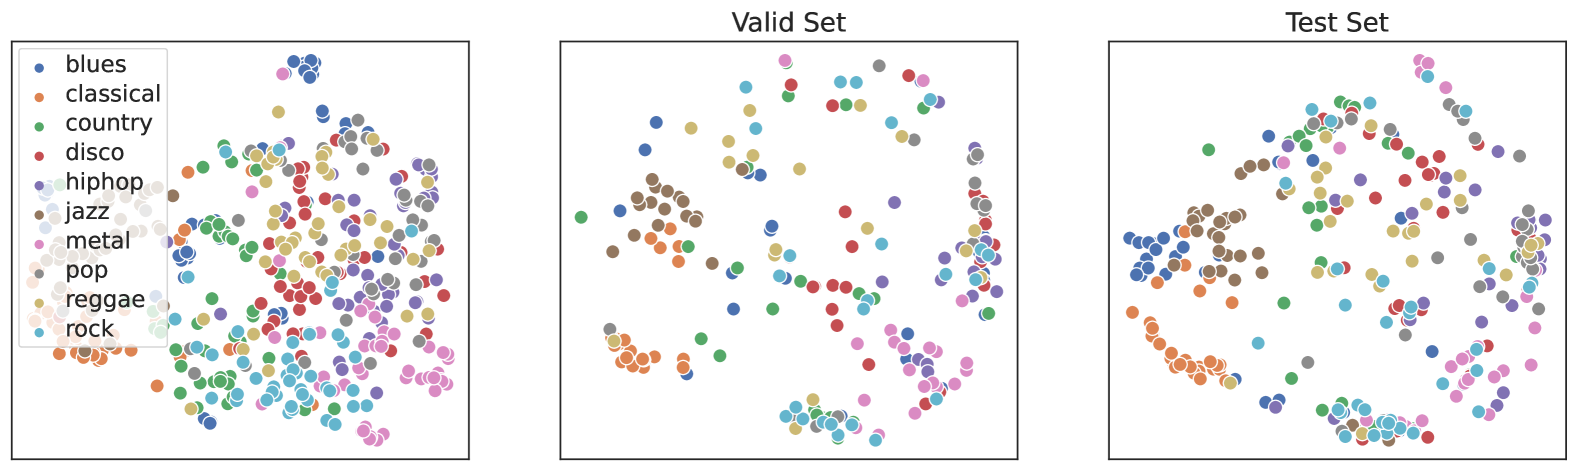
The scatter plot displays the distribution of various music genres across a dataset. The plot is divided into two sections: the "Valid Set" on the left and the "Test Set" on the right. Each section contains a collection of colored dots, representing individual music genres.
### Components/Axes
- **X-axis**: Represents the genre categories, with labels such as blues, classical, country, disco, hip hop, jazz, metal, pop, reggae, and rock.
- **Y-axis**: Not explicitly labeled, but it likely represents another dimension of the data, possibly related to the popularity or frequency of each genre.
- **Legend**: Located on the left side of the plot, it matches the colors of the dots to their corresponding genres.
- **Data Points**: Each dot represents a single music genre, with its position on the plot indicating its distribution across the two sets.
### Detailed Analysis
- **Valid Set**: The dots in this section are more densely packed, indicating a higher concentration of genres within this set.
- **Test Set**: The dots are more spread out, suggesting a more diverse distribution of genres in this set.
### Key Observations
- **Blues**: Appears to be a common genre in both sets.
- **Rock**: Also present in both sets, but in smaller numbers compared to blues.
- **Disco**: More prevalent in the test set.
- **Hip Hop**: More prevalent in the valid set.
- **Jazz**: More prevalent in the test set.
- **Metal**: More prevalent in the valid set.
- **Pop**: More prevalent in the test set.
- **Reggae**: More prevalent in the valid set.
### Interpretation
The scatter plot suggests that the genres are distributed differently between the valid and test sets. The genres that are more prevalent in the valid set, such as blues, rock, and jazz, are also more prevalent in the test set. Conversely, genres like disco, hip hop, and reggae are more prevalent in the test set. This could indicate that the genres are more consistent in the valid set, while the test set may have a more diverse or less consistent distribution. The presence of outliers, such as genres that are not represented in the test set, could suggest that these genres are less common or less represented in the dataset.