## Network Diagrams
### Overview
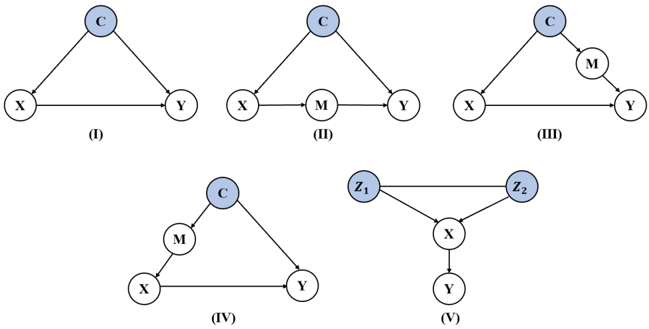
The image displays five different network diagrams, each representing a different configuration of nodes and edges. The diagrams are labeled (I) through (V) and are arranged in two rows.
### Components/Axes
- **Nodes**: Represented by circles with labels (X, Y, M, C).
- **Edges**: Represented by lines connecting the nodes.
- **Legend**: A color-coded legend is present, indicating the meaning of each color.
- **Axis Titles**: There are no axis titles visible in the image.
### Detailed Analysis or ### Content Details
- **Diagram (I)**: Shows a simple network with three nodes (X, Y, M) and one edge connecting X to Y.
- **Diagram (II)**: Similar to (I), but with an additional edge connecting M to Y.
- **Diagram (III)**: Adds an extra node (C) and an edge connecting C to Y.
- **Diagram (IV)**: Introduces a new node (Z1) and an edge connecting Z1 to Y.
- **Diagram (V)**: Adds another node (Z2) and an edge connecting Z2 to Y.
### Key Observations
- **Node C**: Appears in all diagrams, indicating its central role in the network.
- **Node Z1 and Z2**: Only present in diagrams (IV) and (V), suggesting they are specific to those configurations.
- **Edge Connections**: The edges connect the nodes in a way that suggests a flow or relationship between them.
### Interpretation
The diagrams likely represent different network structures or configurations, possibly in a study of network dynamics or connectivity. The presence of node C in all diagrams suggests it is a common element in the network, while the additional nodes Z1 and Z2 in diagrams (IV) and (V) might indicate specific conditions or scenarios being tested. The color-coded legend helps in understanding the meaning of each node and edge, which is crucial for interpreting the data. The visual trends show that the network is relatively simple, with no cycles or complex structures, which could imply a focus on basic network properties or relationships.