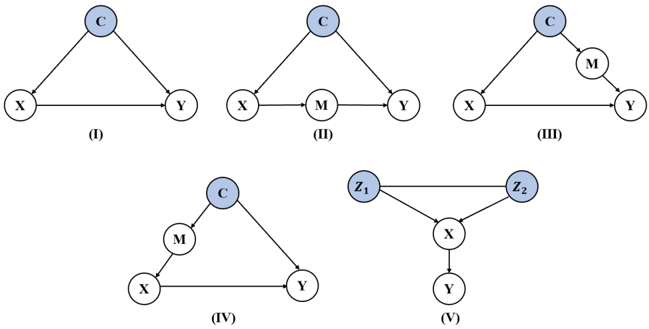
## Diagram Analysis: Network Topology Configurations
### Overview
The image presents five distinct network diagrams (I–V) illustrating variations in node connectivity and pathway structures. Each diagram uses labeled nodes (C, X, Y, M, Z₁, Z₂) and directional edges to represent relationships.
### Components/Axes
- **Nodes**:
- **C**: Central node (highlighted in blue) in diagrams I–IV.
- **X, Y**: Terminal nodes in all diagrams.
- **M**: Mediator node in diagrams II, III, and IV.
- **Z₁, Z₂**: Terminal nodes in diagram V.
- **Edges**:
- Solid lines denote direct connections.
- No explicit labels on edges, but spatial positioning implies directional flow (e.g., top-to-bottom in V).
### Detailed Analysis
#### Diagram I
- **Structure**: Triangle with C connected to X and Y, and X connected to Y.
- **Key Features**: Direct bidirectional links between all nodes.
#### Diagram II
- **Structure**: C connected to X and Y; X connected to M, M connected to Y.
- **Key Features**: Introduces a mediator (M) between X and Y, creating a two-hop path.
#### Diagram III
- **Structure**: C connected to X and Y; X connected to M, M connected to Y, and C connected to M.
- **Key Features**: Adds a direct C–M link, enabling shorter paths between C and Y.
#### Diagram IV
- **Structure**: C connected to M, M connected to X and Y.
- **Key Features**: Centralizes M as a hub, with C acting as a root node.
#### Diagram V
- **Structure**: Z₁ connected to X, X connected to Y and Z₂, Y connected to Z₂.
- **Key Features**: Forms a diamond-shaped network with Z₁ and Z₂ as endpoints.
### Key Observations
1. **Mediator Role**: M appears in diagrams II–IV, acting as an intermediary to connect X and Y.
2. **Centralization**: C is central in diagrams I–IV but absent in V, where Z₁ and Z₂ dominate.
3. **Path Diversity**: Diagram III offers the most pathways (C–X–Y, C–M–Y, X–M–Y), while V has the fewest (Z₁–X–Y–Z₂).
### Interpretation
These diagrams likely model network architectures or data flow systems:
- **Diagrams I–IV** emphasize hierarchical or mediated communication, with C as a control node. The introduction of M in II–IV suggests redundancy or load-balancing strategies.
- **Diagram V** shifts focus to a decentralized structure, with Z₁ and Z₂ as endpoints. This could represent a peer-to-peer system or distributed processing model.
- **Notable Trends**: The removal of C in V and addition of Z nodes imply a transition from centralized to distributed architectures. Diagram III’s multiple pathways highlight fault tolerance, while V’s linear Z₁–X–Y–Z₂ path suggests sequential processing.
No numerical data or color-coded legends are present; interpretations rely solely on structural analysis.