# Technical Document Extraction: Diagram Analysis
## Diagram Structure Overview
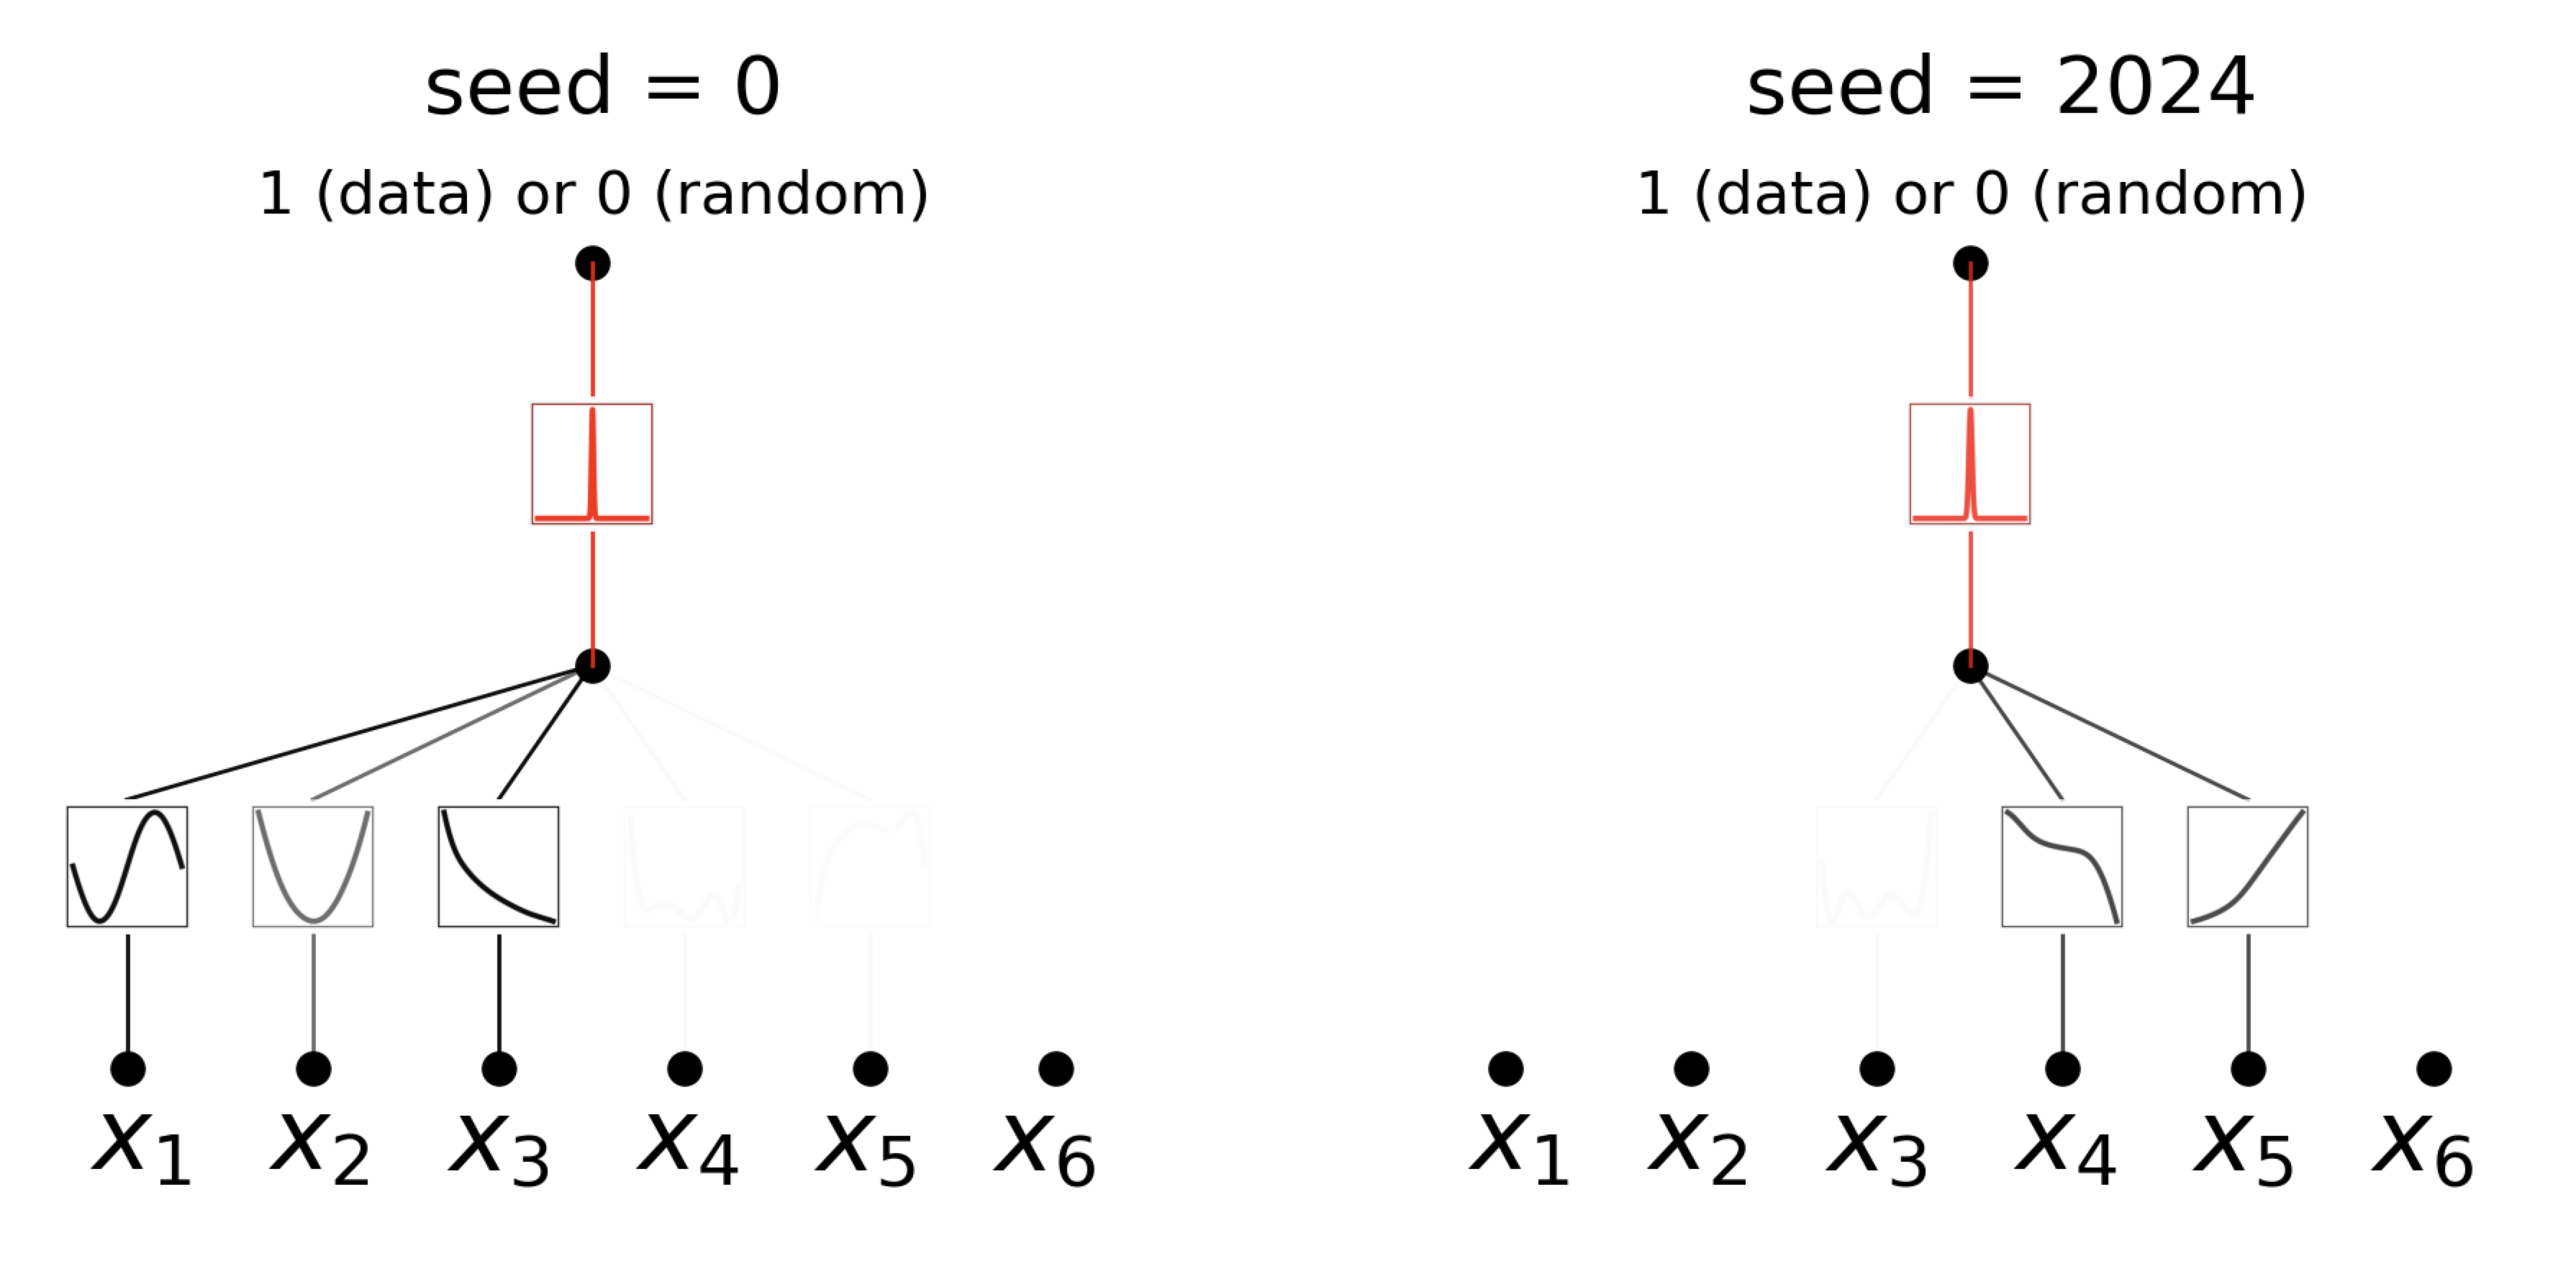
The image contains **two side-by-side diagrams** labeled with distinct seed values. Both diagrams share a consistent structure but differ in seed initialization and node connectivity.
---
### **Left Diagram: `seed = 0`**
#### Header Text
- **Seed Label**: `seed = 0`
- **Data/Random Indicator**: `1 (data) or 0 (random)`
#### Central Node
- A **black dot** connected to a **vertical red line** with a **red box** around its midpoint.
- The red line extends upward from the central node, terminating at the top of the diagram.
#### X Nodes (X₁–X₆)
- Six nodes labeled **X₁** to **X₆**, arranged horizontally below the central node.
- Each node has a **black dot** and a **square** containing a waveform (graph-like line).
- **Connectivity**:
- **X₁**: Waveform with a **sinusoidal curve** (peaks and troughs).
- **X₂**: Waveform with a **parabolic curve** (U-shaped).
- **X₃**: Waveform with a **linear decline** (downward slope).
- **X₄**: Waveform with a **noisy, irregular curve**.
- **X₅**: Waveform with a **linear increase** (upward slope).
- **X₆**: Empty square (no waveform).
#### Connections
- Lines connect the central node to all X nodes (X₁–X₆).
- Additional lines connect:
- **X₄** to **X₅** (dashed line).
- **X₅** to **X₆** (dashed line).
---
### **Right Diagram: `seed = 2024`**
#### Header Text
- **Seed Label**: `seed = 2024`
- **Data/Random Indicator**: `1 (data) or 0 (random)`
#### Central Node
- Identical to the left diagram: **black dot** with a **vertical red line** and **red box**.
#### X Nodes (X₁–X₆)
- Six nodes labeled **X₁** to **X₆**, arranged horizontally below the central node.
- **Waveform Differences**:
- **X₁**: Empty square.
- **X₂**: Empty square.
- **X₃**: Empty square.
- **X₄**: Waveform with a **noisy, irregular curve** (same as left diagram).
- **X₅**: Waveform with a **linear increase** (same as left diagram).
- **X₆**: Waveform with a **linear increase** (new addition).
#### Connections
- Lines connect the central node to all X nodes (X₁–X₆).
- Additional lines connect:
- **X₄** to **X₅** (dashed line).
- **X₅** to **X₆** (dashed line).
---
### Key Observations
1. **Seed Dependency**:
- The left diagram (`seed = 0`) shows more populated waveforms (X₁–X₅), while the right diagram (`seed = 2024`) has fewer waveforms (X₄–X₆).
- Seed value appears to influence the initialization or activation of nodes.
2. **Waveform Patterns**:
- Waveforms in squares likely represent **data signals** or **random noise** (as indicated by the `1 (data) or 0 (random)` label).
- Patterns vary by node (e.g., sinusoidal, parabolic, linear).
3. **Connectivity**:
- Dashed lines between X₄–X₅–X₆ suggest **conditional or secondary relationships** between nodes.
4. **Red Line/Box**:
- The red line and box around the central node may denote a **critical threshold** or **activation point** in the system.
---
### Technical Implications
- The diagrams likely model a **probabilistic or algorithmic process** where:
- Seed values determine initial conditions.
- Nodes (X₁–X₆) represent variables or features.
- Waveforms indicate data presence/absence or signal strength.
- Connectivity defines dependencies or transitions between variables.
---
### Missing Elements
- No explicit **legend** or **axis titles** are present.
- No numerical data or quantitative labels are provided (e.g., time, magnitude).
- The purpose of the red line/box and dashed connections is inferred but not explicitly labeled.
---
### Summary
The diagrams illustrate a **seed-dependent system** with nodes (X₁–X₆) that exhibit varying data patterns based on initialization. The red line/box and connectivity suggest a hierarchical or conditional structure, possibly for data processing or simulation.