## Timeline of Neural Network and LLM Development
### Overview
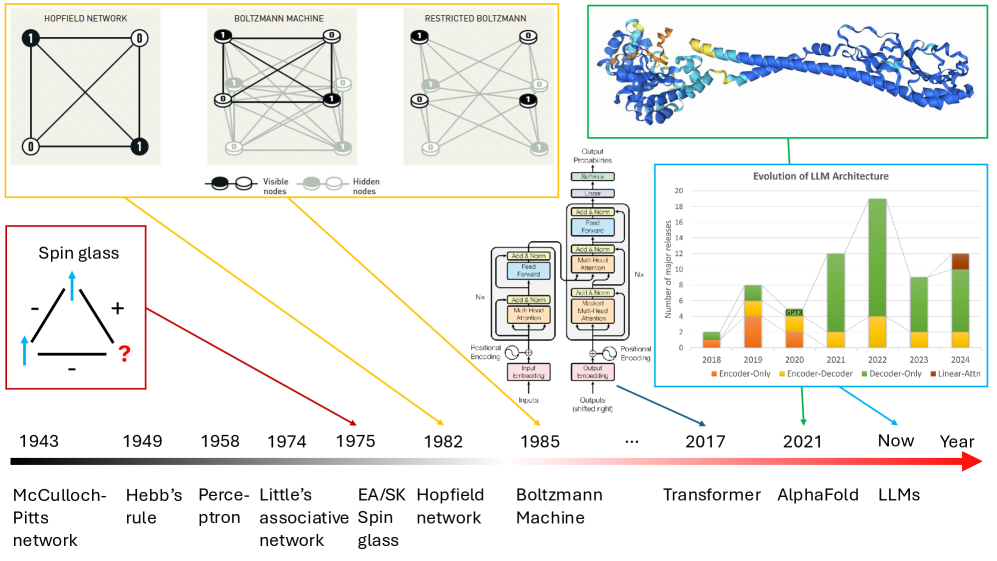
The image presents a timeline illustrating the evolution of neural networks and Large Language Models (LLMs) from 1943 to the present day. It includes diagrams of various network architectures, a protein structure, and a bar chart showing the number of major releases of different LLM architectures over time.
### Components/Axes
* **Timeline Axis:** A horizontal arrow labeled "Year" spans from 1943 to "Now," with key years marked.
* **Network Diagrams:**
* Hopfield Network: A square with four nodes, each labeled "0" or "1," connected by lines.
* Boltzmann Machine: A similar structure with visible and hidden nodes.
* Restricted Boltzmann Machine: Similar to the Boltzmann Machine.
* **Spin Glass Diagram:** A triangle with "+" and "-" signs, and arrows indicating spin directions.
* **Transformer Architecture Diagram:** A block diagram illustrating the components of a transformer network, including positional encoding, input/output embeddings, multi-head attention, and feed-forward layers.
* **Protein Structure:** A 3D rendering of a protein structure, likely related to AlphaFold.
* **LLM Architecture Evolution Chart:**
* X-axis: Years from 2018 to 2024.
* Y-axis: "Number of major releases," ranging from 0 to 20.
* Legend:
* Encoder-Only (Blue)
* Encoder-Decoder (Orange)
* Decoder-Only (Green)
* Linear-Attn (Brown)
### Detailed Analysis
**Timeline Events:**
* **1943:** McCulloch-Pitts network
* **1949:** Hebb's rule
* **1958:** Perceptron
* **1974:** Little's associative network
* **1975:** EA/SK Spin glass
* **1982:** Hopfield network
* **1985:** Boltzmann Machine
* **2017:** Transformer
* **2021:** AlphaFold
* **Now:** LLMs
**LLM Architecture Evolution Chart:**
* **2018:** Encoder-Only: ~2
* **2019:** Encoder-Only: ~4, Encoder-Decoder: ~3, Total: ~7
* **2020:** Encoder-Only: ~1, Encoder-Decoder: ~2, Total: ~3. "GPT3" is labeled near this bar.
* **2021:** Decoder-Only: ~12
* **2022:** Decoder-Only: ~19
* **2023:** Decoder-Only: ~9
* **2024:** Decoder-Only: ~11, Linear-Attn: ~1, Total: ~12
**Network Diagrams:**
* **Hopfield Network:** Contains four nodes arranged in a square. Two nodes are filled black and labeled "1", while the other two are white and labeled "0". Each node is connected to every other node.
* **Boltzmann Machine:** Contains four visible nodes (two black "1", two white "0") and four hidden nodes (all gray "0"). All nodes are interconnected.
* **Restricted Boltzmann Machine:** Contains four visible nodes (two black "1", two white "0") and four hidden nodes (all gray "0"). All nodes are interconnected.
**Spin Glass Diagram:**
* A triangle with arrows indicating spin directions. Two arrows point upwards (blue), and one points downwards. "+" and "-" signs are placed at the corners. A question mark in red is placed at the bottom right corner.
**Transformer Architecture Diagram:**
* Illustrates the flow of data through a transformer network, including input and output embeddings, positional encoding, multi-head attention, and feed-forward layers.
### Key Observations
* The timeline highlights the progression from early neural network models to modern LLMs.
* The LLM architecture chart shows a significant increase in the number of Decoder-Only model releases, especially after 2020.
* The protein structure likely represents the impact of AI, specifically AlphaFold, on protein structure prediction.
### Interpretation
The image effectively visualizes the historical development of neural networks and LLMs. The shift from Encoder-Only and Encoder-Decoder architectures to predominantly Decoder-Only models suggests a trend towards sequence-to-sequence models and generative AI. The inclusion of AlphaFold indicates the broader impact of AI on scientific domains beyond natural language processing. The Spin Glass diagram represents a problem in physics that has connections to neural networks. The question mark suggests an unknown or unresolved aspect of the system.