TECHNICAL ASSET FINGERPRINT
9bbd39bec0b7ab473da75eac
Click to view fullscreen
Press ESC or click to close
FOUND IN PAPERS
EXPERT: healer-alpha-free VERSION 1
RUNTIME: free/openrouter/healer-alpha
INTEL_VERIFIED
## Diagram: Timeline of Neural Network and AI Architecture Evolution
### Overview
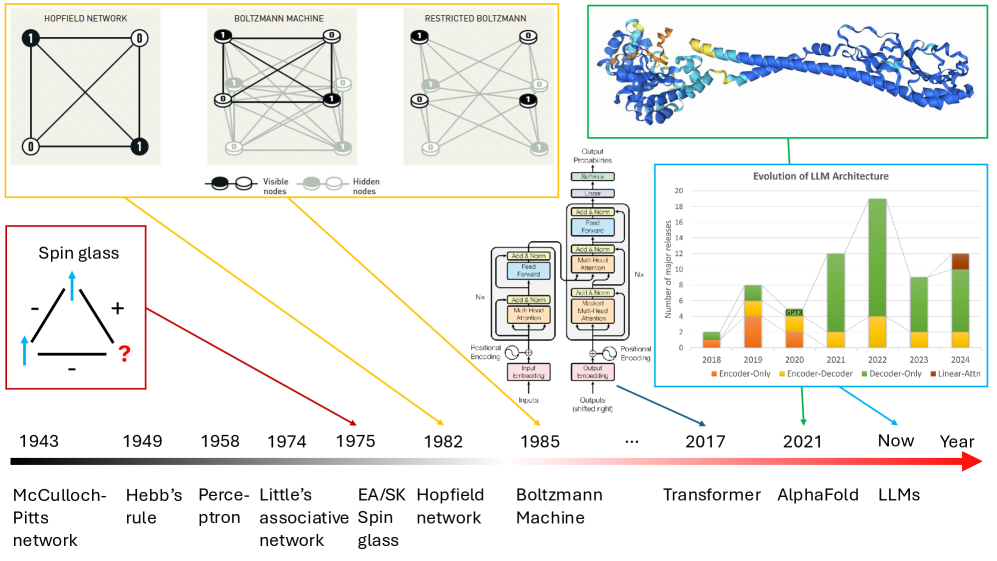
The image is a complex informational diagram illustrating the historical evolution of key concepts, architectures, and models in artificial intelligence and neural networks. It features a central timeline at the bottom, with various diagrams and charts positioned above it, connected by colored arrows indicating their chronological relationship to specific years. The overall narrative traces the path from early theoretical models to modern large language models (LLMs) and protein structure prediction.
### Components/Axes
The diagram is segmented into several distinct visual components:
1. **Central Timeline (Bottom):** A horizontal black-to-red gradient arrow labeled "Year" at the far right. It marks specific years from 1943 to "Now" (implied present, circa 2024/2025). Below each year is a corresponding milestone.
2. **Network Architecture Diagrams (Top Left):** Three network graphs enclosed in a yellow-bordered box.
* **Hopfield Network:** A fully connected graph with 4 nodes labeled with binary states (1, 0, 0, 1).
* **Boltzmann Machine:** A fully connected graph with 4 nodes (2 black, 2 white) and visible/hidden node legend.
* **Restricted Boltzmann Machine:** A bipartite graph with 2 black "Visible nodes" and 2 white "Hidden nodes," with connections only between layers.
* **Legend:** Below the networks, a key defines "Visible nodes" (black circle) and "Hidden nodes" (white circle).
3. **Spin Glass Diagram (Left):** A red-bordered box containing a triangular diagram labeled "Spin glass." It shows three arrows (two blue, one black) with "+" and "-" signs and a red question mark, representing frustrated states.
4. **Protein Structure (Top Right):** A green-bordered box containing a 3D ribbon diagram of a protein structure, colored in blue, yellow, and orange. This is visually linked to the "AlphaFold" milestone on the timeline.
5. **Transformer Architecture Diagram (Center Right):** A detailed schematic of the Transformer model architecture, showing components like "Input embedding," "Positional Encoding," "Multi-Head Attention," "Feed Forward," "Add & Norm," and "Output (shifted right)."
6. **LLM Evolution Bar Chart (Right):** A blue-bordered box containing a stacked bar chart titled "Evolution of LLM Architecture."
* **Y-axis:** "Number of major releases," scaled from 0 to 20.
* **X-axis:** Years from 2018 to 2024.
* **Legend:** Four categories: "Encoder-Only" (orange), "Encoder-Decoder" (yellow), "Decoder-Only" (green), "Linear-Attn" (brown).
* **Data:** Stacked bars for each year showing the count of major model releases per architecture type.
### Detailed Analysis
**Timeline Milestones (Chronological Order):**
* **1943:** McCulloch-Pitts network
* **1949:** Hebb's rule
* **1958:** Perceptron
* **1974:** Little's associative network
* **1975:** EA/SK Spin glass (connected via red arrow to the "Spin glass" diagram)
* **1982:** Hopfield network (connected via yellow arrow to the "Hopfield Network" diagram)
* **1985:** Boltzmann Machine (connected via yellow arrow to the "Boltzmann Machine" and "Restricted Boltzmann" diagrams)
* **...** (ellipsis indicating a gap)
* **2017:** Transformer (connected via blue arrow to the "Transformer Architecture" diagram)
* **2021:** AlphaFold (connected via green arrow to the "Protein Structure" image)
* **Now:** LLMs (connected via blue arrow to the "Evolution of LLM Architecture" chart)
**LLM Evolution Chart Data (Approximate Values):**
* **2018:** ~2 Encoder-Only, ~1 Encoder-Decoder. Total: ~3.
* **2019:** ~4 Encoder-Only, ~3 Encoder-Decoder, ~1 Decoder-Only. Total: ~8.
* **2020:** ~3 Encoder-Only, ~2 Encoder-Decoder, ~1 Decoder-Only. Total: ~6.
* **2021:** ~2 Encoder-Only, ~1 Encoder-Decoder, ~9 Decoder-Only. Total: ~12.
* **2022:** ~1 Encoder-Only, ~1 Encoder-Decoder, ~17 Decoder-Only. Total: ~19.
* **2023:** ~1 Encoder-Only, ~1 Encoder-Decoder, ~7 Decoder-Only. Total: ~9.
* **2024:** ~1 Encoder-Only, ~1 Encoder-Decoder, ~9 Decoder-Only, ~1 Linear-Attn. Total: ~12.
**Trend Verification (LLM Chart):**
* **Encoder-Only (Orange):** Shows a declining trend from a peak in 2019 to minimal presence by 2022-2024.
* **Encoder-Decoder (Yellow):** Remains a small, relatively stable component from 2018 to 2024.
* **Decoder-Only (Green):** Shows a dramatic, dominant upward trend starting in 2020, peaking in 2022, and remaining the most common architecture through 2024.
* **Linear-Attn (Brown):** Appears only in 2024 as a very small segment.
### Key Observations
1. **Architectural Shift:** The bar chart clearly illustrates a major industry shift from Encoder-Only and Encoder-Decoder models towards Decoder-Only architectures (like GPT) starting around 2020-2021.
2. **Theoretical Foundations:** The diagram explicitly links modern deep learning (Transformers, LLMs) to much older theoretical concepts in statistical physics (Spin glasses, 1975) and associative memory (Hopfield networks, 1982).
3. **Convergence of Fields:** The inclusion of AlphaFold (2021) alongside LLMs highlights the parallel, significant impact of deep learning in the scientific domain of protein structure prediction.
4. **Pacing of Innovation:** The timeline shows long gaps between foundational theories (1940s-1980s) and their explosive application in the 2010s and 2020s, suggesting a period of incubation followed by rapid scaling.
### Interpretation
This diagram constructs a **genealogy of modern AI**. It argues that today's most powerful AI systems, particularly LLMs, are not sudden inventions but the culmination of decades of research in interconnected fields.
* **From Physics to Computation:** It draws a direct line from concepts in statistical mechanics (spin glasses, Boltzmann machines) which deal with disordered systems and energy states, to neural network models that use similar principles for optimization and learning (e.g., using energy functions in Hopfield and Boltzmann networks).
* **The Transformer as a Pivot Point:** The year 2017 is marked as a critical juncture with the introduction of the Transformer. Its architecture diagram is centrally placed, acting as the bridge between earlier network theories and the subsequent explosion of LLMs.
* **The "Decoder-Only" Takeover:** The LLM chart provides quantitative evidence for a paradigm shift in AI research and development. The dominance of Decoder-Only models suggests a convergence on a specific, scalable architecture for generative tasks, which has become the foundation for the current generation of AI assistants and tools.
* **AI as a General-Purpose Tool:** By placing AlphaFold (a specialized scientific tool) on the same timeline as general-purpose LLMs, the diagram suggests that the underlying deep learning revolution is domain-agnostic, capable of driving breakthroughs in both open-ended language tasks and precise scientific problems.
In essence, the image is a visual thesis on the **historical continuity and accelerating convergence** of ideas that have led to the current state of artificial intelligence.
DECODING INTELLIGENCE...