## Line Graphs: Model Performance Metrics vs Training Time
### Overview
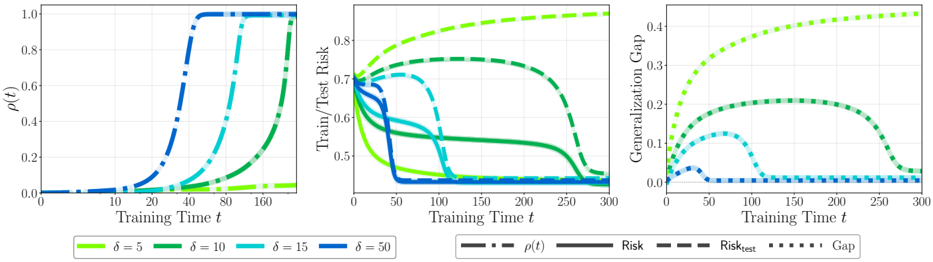
Three line graphs depict the evolution of three metrics (ρ(t), Train/Test Risk, Generalization Gap) across training time (t) for four hyperparameter values (δ = 5, 10, 15, 50). Each graph shows distinct trends with δ values represented by different colors.
### Components/Axes
1. **X-axis**: Training Time (t) ranging from 0 to 300 in all graphs
2. **Y-axes**:
- Left graph: ρ(t) (0-1 scale)
- Middle graph: Train/Test Risk (0.4-0.8 scale)
- Right graph: Generalization Gap (0-0.4 scale)
3. **Legends**:
- Bottom of each graph
- Colors: δ=5 (yellow), δ=10 (green), δ=15 (cyan), δ=50 (blue)
- Line styles: Solid for ρ(t), dashed for Risk, dotted for Gap
### Detailed Analysis
**Left Graph (ρ(t))**:
- All δ values start at 0
- Sharp rise begins ~t=40 for all δ
- δ=50 reaches 1.0 by t=80 (highest)
- δ=5 remains lowest (plateaus ~0.2 by t=160)
- Approximate values:
- δ=5: 0.2 (t=160)
- δ=10: 0.3 (t=160)
- δ=15: 0.4 (t=160)
- δ=50: 1.0 (t=80)
**Middle Graph (Train/Test Risk)**:
- All δ start ~0.7 at t=0
- δ=50 drops fastest (0.5 by t=100)
- δ=5 remains highest (0.6 by t=100)
- Approximate values:
- δ=5: 0.6 (t=100)
- δ=10: 0.55 (t=100)
- δ=15: 0.52 (t=100)
- δ=50: 0.5 (t=100)
**Right Graph (Generalization Gap)**:
- All δ start at 0
- δ=5 peaks highest (~0.35 at t=100)
- δ=50 peaks lowest (~0.15 at t=100)
- All δ show decline after t=100
- Approximate values:
- δ=5: 0.35 (t=100)
- δ=10: 0.3 (t=100)
- δ=15: 0.25 (t=100)
- δ=50: 0.15 (t=100)
### Key Observations
1. **δ Inversely Correlated with Risk**: Higher δ values achieve lower risk faster (δ=50 reaches 0.5 risk at t=100 vs δ=5 at 0.6)
2. **Generalization Gap Peaks**: All δ show peak generalization gap ~t=100, with δ=5 having largest gap (0.35)
3. **ρ(t) Saturation**: δ=50 saturates ρ(t) earliest (t=80), while δ=5 remains unsaturated at t=160
4. **Consistent Trends**: All δ values show similar shape patterns across metrics, with δ=50 consistently outperforming others
### Interpretation
The data suggests δ acts as a regularization parameter:
- Higher δ values (50) reduce overfitting (lower risk, smaller generalization gap)
- Lower δ values (5) show more pronounced overfitting (higher risk, larger gap)
- The peak generalization gap at t=100 indicates a critical point where models begin overfitting before δ regularization takes full effect
- ρ(t) saturation patterns correlate with risk reduction timing, suggesting ρ(t) may represent model confidence or density of learned features
- The consistent δ ordering across all metrics implies a unified mechanism governing model behavior across training phases