## Line Chart: GLM-4.7 (358B) Performance Analysis
### Overview
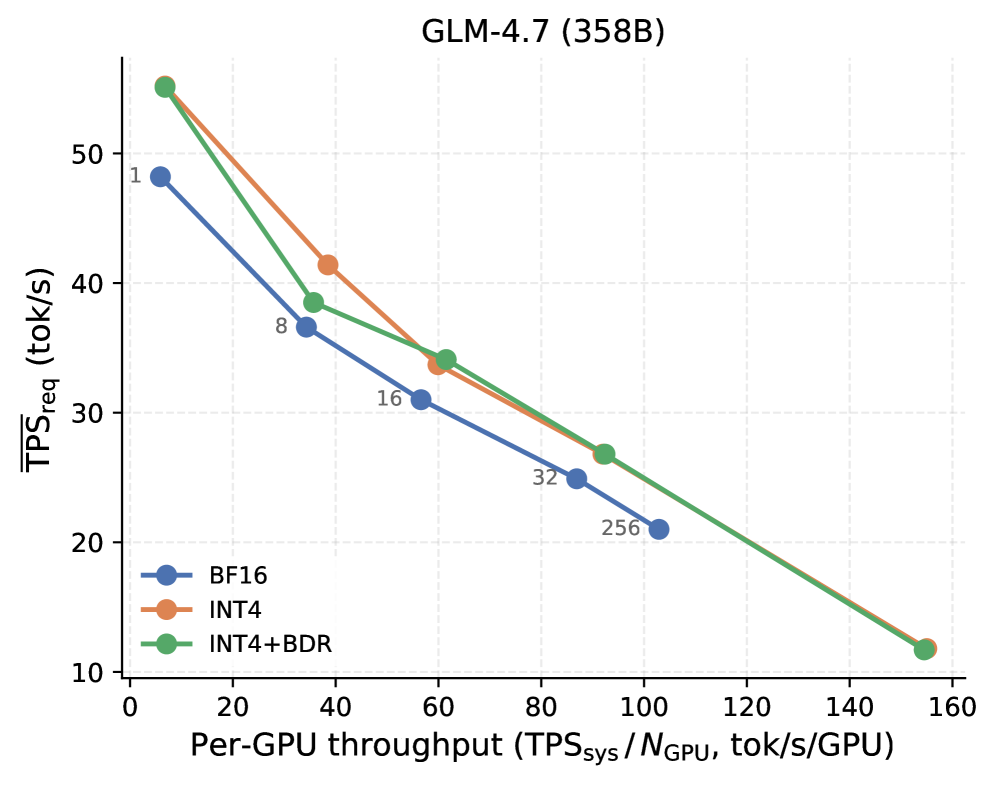
The chart compares the relationship between **per-GPU throughput** (x-axis) and **required tokens per second (TPS_req)** (y-axis) for three configurations of the GLM-4.7 (358B) model: BF16, INT4, and INT4+BDR. All three lines show a decreasing trend, indicating that higher throughput reduces the required TPS_req.
### Components/Axes
- **X-axis**: "Per-GPU throughput (TPS_sys/N_GPU, tok/s/GPU)"
- Scale: 0 to 160 (logarithmic spacing implied by gridlines).
- Key markers: 1, 8, 16, 32, 80, 100, 160.
- **Y-axis**: "TPS_req (tok/s)"
- Scale: 10 to 50 (linear increments of 10).
- **Legend**: Bottom-left corner, with color-coded labels:
- Blue: BF16
- Orange: INT4
- Green: INT4+BDR
### Detailed Analysis
#### Data Points and Trends
1. **BF16 (Blue Line)**
- Starts at **~48 TPS_req** at 1 tok/s/GPU.
- Drops sharply to **~38 TPS_req** at 8 tok/s/GPU.
- Continues declining to **~31 TPS_req** at 16 tok/s/GPU.
- Further reduces to **~26 TPS_req** at 32 tok/s/GPU.
- Ends at **~20 TPS_req** at 100 tok/s/GPU.
- **Trend**: Steepest initial decline, then gradual flattening.
2. **INT4 (Orange Line)**
- Starts at **~55 TPS_req** at 1 tok/s/GPU.
- Drops to **~41 TPS_req** at 40 tok/s/GPU.
- Reduces to **~33 TPS_req** at 60 tok/s/GPU.
- Further declines to **~28 TPS_req** at 80 tok/s/GPU.
- Ends at **~25 TPS_req** at 100 tok/s/GPU.
- **Trend**: Consistent linear decline, slower than BF16.
3. **INT4+BDR (Green Line)**
- Starts at **~55 TPS_req** at 1 tok/s/GPU (same as INT4).
- Drops to **~38 TPS_req** at 40 tok/s/GPU.
- Reduces to **~33 TPS_req** at 60 tok/s/GPU.
- Further declines to **~27 TPS_req** at 80 tok/s/GPU.
- Ends at **~25 TPS_req** at 100 tok/s/GPU.
- **Trend**: Similar to INT4 but slightly lower TPS_req at higher throughputs.
### Key Observations
- All configurations show **inverse proportionality**: Higher throughput reduces TPS_req.
- **BF16** requires the highest TPS_req initially but converges with INT4+BDR at 100 tok/s/GPU.
- **INT4+BDR** outperforms INT4 at 80 and 100 tok/s/GPU, suggesting BDR improves efficiency.
- At 160 tok/s/GPU, all lines extrapolate to **~12–15 TPS_req**, though data is not explicitly plotted.
### Interpretation
The chart demonstrates that **model precision and optimization techniques** (e.g., BDR) significantly impact throughput efficiency.
- **BF16** (likely 16-bit floating-point) has higher computational overhead, requiring more TPS_req even at lower throughputs.
- **INT4** (4-bit integer) and **INT4+BDR** (with BDR, possibly batch data reuse or quantization) achieve better scalability.
- The convergence of INT4 and INT4+BDR at high throughputs implies BDR mitigates precision-related bottlenecks.
- The steep decline in BF16 suggests it is less optimized for high-throughput scenarios compared to INT4 variants.
This analysis highlights trade-offs between model precision, optimization methods, and system performance in large language models like GLM-4.7.