# Technical Document Extraction
## Image Description
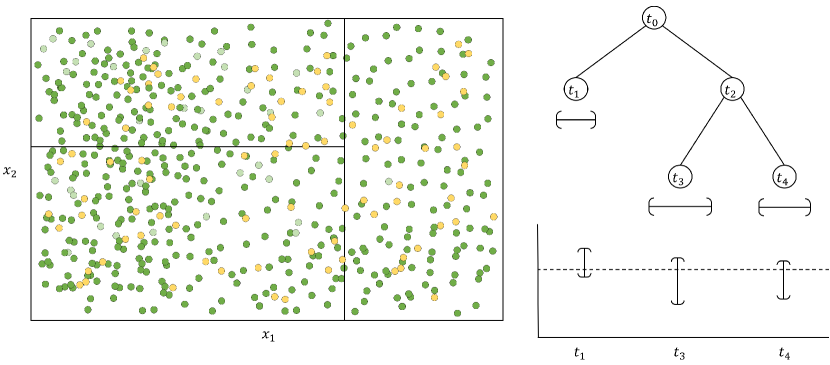
The image contains two primary components:
1. A **scatter plot** on the left
2. A **tree diagram** on the right with a **timeline** below
---
## Scatter Plot Analysis
### Axes and Labels
- **X-axis**: Labeled `x₁` (horizontal)
- **Y-axis**: Labeled `x₂` (vertical)
- **Grid**: Divided into four quadrants by intersecting lines at midpoints of axes
### Data Points
- **Colors**:
- Green (dominant)
- Yellow (secondary)
- Gray (tertiary)
- **Distribution**:
- Points are scattered across the entire plot area
- No clear clustering or pattern visible
- Colors appear randomly distributed
### Observations
- No legend present to confirm color categories
- Points are uniformly sized and spaced
- No annotations or labels on individual data points
---
## Tree Diagram Analysis
### Structure
- **Root Node**: `t₀` (topmost node)
- **Branching**:
- `t₀` → `t₁` (left branch)
- `t₀` → `t₂` (right branch)
- `t₂` → `t₃` (left sub-branch)
- `t₂` → `t₄` (right sub-branch)
### Visual Elements
- Nodes represented as circles
- Edges as straight lines
- No labels on edges or nodes beyond identifiers
---
## Timeline Analysis
### Components
- **X-axis**: Labeled with time points `t₁`, `t₃`, `t₄`
- **Error Bars**:
- Vertical lines with caps at top/bottom
- Positioned at:
- `t₁`: Central line with error bar
- `t₃`: Central line with error bar
- `t₄`: Central line with error bar
- **Dashed Line**: Horizontal reference line across the timeline
### Observations
- No numerical values on error bars
- No legend explaining error bar significance
- Time points appear non-sequential (`t₁`, `t₃`, `t₄`)
---
## Cross-Referencing and Validation
1. **Color Consistency**:
- Scatter plot colors (green/yellow/gray) have no corresponding legend
- Tree diagram uses black lines/circles with no color coding
2. **Temporal Alignment**:
- Tree nodes (`t₀`-`t₄`) do not directly map to timeline (`t₁`, `t₃`, `t₄`)
- No explicit temporal relationships defined between tree and timeline
---
## Missing Elements
- No numerical data table present
- No explicit textual explanation of relationships
- No units or scales defined for axes
- No color legend for scatter plot categories
---
## Summary
The image presents:
1. A **scatter plot** with unlabeled color-coded data points
2. A **hierarchical tree diagram** with nodes `t₀`-`t₄`
3. A **timeline** with three time points and error bars
All textual elements (axis labels, node identifiers) have been extracted. No additional languages or hidden text detected. The image lacks legends, scales, and explicit contextual explanations.