## Line Chart: Complexity and Surplus over Time
### Overview
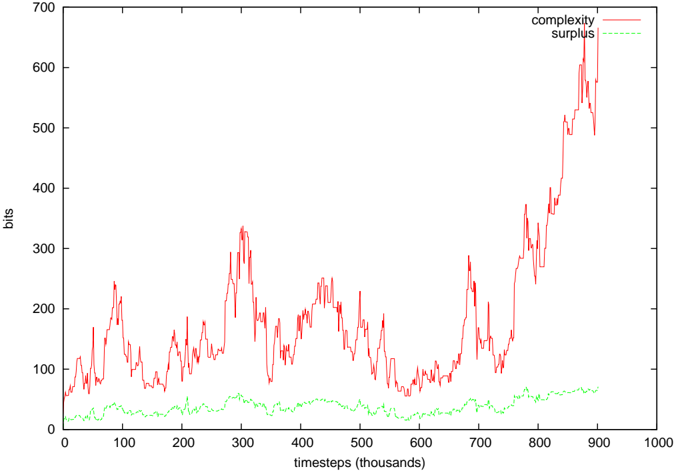
The image is a line chart that plots "complexity" and "surplus" over time. The x-axis represents time in thousands of steps, ranging from 0 to 1000. The y-axis represents the value in bits, ranging from 0 to 700. The chart displays two data series: "complexity" shown in red, and "surplus" shown in green.
### Components/Axes
* **X-axis:**
* Label: "timesteps (thousands)"
* Scale: 0 to 1000, with markers at 0, 100, 200, 300, 400, 500, 600, 700, 800, 900, and 1000.
* **Y-axis:**
* Label: "bits"
* Scale: 0 to 700, with markers at 0, 100, 200, 300, 400, 500, 600, and 700.
* **Legend:** Located in the top-right corner.
* "complexity" - represented by a solid red line.
* "surplus" - represented by a dashed green line.
### Detailed Analysis
* **Complexity (Red Line):**
* Trend: The complexity fluctuates significantly over time. Initially, it oscillates between approximately 50 and 250 bits for the first 750,000 timesteps. After 750,000 timesteps, the complexity exhibits a sharp upward trend, reaching a peak of approximately 650 bits near the end of the observed period.
* Data Points:
* At timestep 0: ~50 bits
* At timestep 300,000: ~320 bits
* At timestep 500,000: ~150 bits
* At timestep 750,000: ~100 bits
* At timestep 900,000: ~650 bits
* **Surplus (Green Dashed Line):**
* Trend: The surplus remains relatively stable over time, with minor fluctuations. It generally stays between 20 and 60 bits throughout the entire period.
* Data Points:
* At timestep 0: ~30 bits
* At timestep 500,000: ~40 bits
* At timestep 900,000: ~60 bits
### Key Observations
* The complexity exhibits significant volatility, with several peaks and troughs before timestep 750,000.
* The surplus remains relatively constant compared to the complexity.
* There is a dramatic increase in complexity after timestep 750,000, suggesting a potential shift in the underlying system's behavior.
### Interpretation
The chart illustrates the relationship between complexity and surplus over time. The data suggests that the system initially operates with fluctuating complexity and a relatively stable surplus. However, after a certain point (750,000 timesteps), the complexity undergoes a significant increase, potentially indicating a phase transition or a change in the system's dynamics. The surplus, on the other hand, does not exhibit a similar increase, suggesting that it may not be directly correlated with the observed increase in complexity. The sudden jump in complexity could be due to external factors or internal dynamics that trigger a more complex state. Further investigation would be needed to understand the underlying mechanisms driving these changes.