## Line Graph: Complexity vs. Surplus Over Timesteps
### Overview
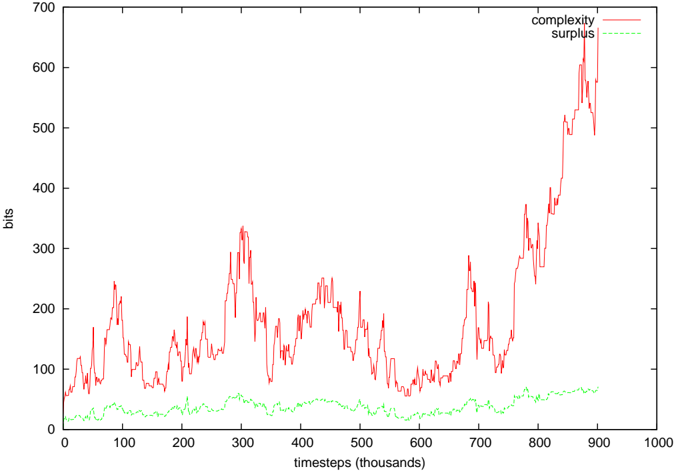
The image depicts a line graph comparing two metrics—**complexity** (red solid line) and **surplus** (green dashed line)—across **1,000 timesteps** (x-axis) measured in thousands. The y-axis represents values in **bits**. The red line exhibits significant volatility, with sharp peaks and troughs, while the green line remains relatively stable but shows a gradual upward trend.
---
### Components/Axes
- **X-axis**: "timesteps (thousands)" (range: 0 to 1,000,000).
- **Y-axis**: "bits" (range: 0 to 700).
- **Legend**:
- **Red solid line**: "complexity" (top-right corner).
- **Green dashed line**: "surplus" (top-right corner).
---
### Detailed Analysis
1. **Complexity (Red Line)**:
- **Initial Phase (0–200k timesteps)**: Starts at ~50 bits, fluctuates between 50–200 bits, with a peak at ~250k timesteps (~300 bits).
- **Mid-Phase (200k–700k timesteps)**: Oscillates between 50–250 bits, with a notable dip to ~50 bits at ~600k timesteps.
- **Final Phase (700k–1,000k timesteps)**: Sharp upward trend, surging from ~200 bits to ~650 bits by 1,000k timesteps.
2. **Surplus (Green Line)**:
- **Entire Range**: Begins at ~10 bits, remains stable between 10–40 bits until ~800k timesteps, then rises steadily to ~60 bits by 1,000k timesteps.
---
### Key Observations
- **Volatility of Complexity**: The red line shows erratic behavior, with multiple peaks and troughs, suggesting instability or external influences.
- **Steady Growth of Surplus**: The green line’s gradual increase contrasts with the red line’s volatility, indicating a more predictable trend.
- **Final Spike in Complexity**: The abrupt rise in complexity at the end (800k–1,000k timesteps) may signal a critical threshold or system failure.
---
### Interpretation
- **Relationship Between Metrics**: Complexity grows disproportionately faster than surplus, particularly in the final phase. This could imply diminishing returns or resource exhaustion as timesteps increase.
- **Anomalies**: The sharp final spike in complexity (650 bits) may represent a tipping point, such as a system collapse or exponential growth event.
- **Implications**: The disparity between complexity and surplus suggests that while surplus increases predictably, complexity’s volatility could destabilize the system over time.
---
**Note**: Exact numerical values are approximated due to the absence of gridlines or labeled data points. Uncertainty in values is inferred from the scale and line positioning.