## Bar Chart: Distribution over valid graph colorings (sorted)
### Overview
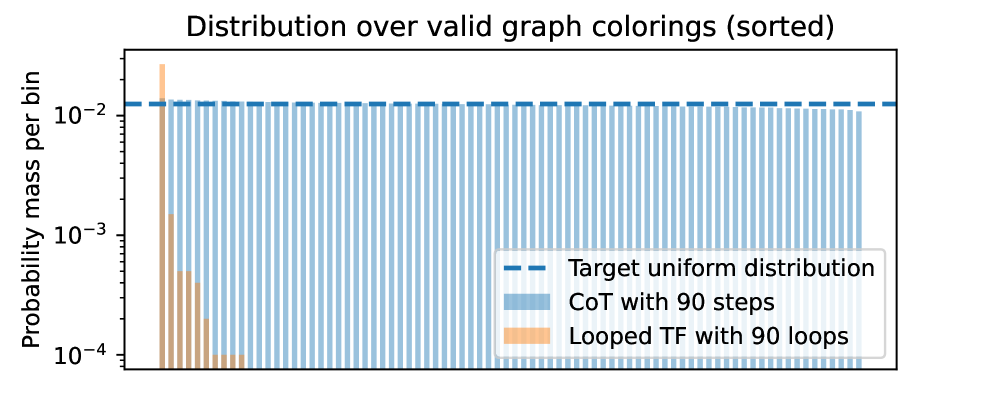
The image is a bar chart comparing the probability mass per bin for different methods of graph coloring: "CoT with 90 steps" and "Looped TF with 90 loops", against a "Target uniform distribution". The x-axis represents the bins (sorted), and the y-axis represents the probability mass per bin on a logarithmic scale.
### Components/Axes
* **Title:** Distribution over valid graph colorings (sorted)
* **Y-axis Label:** Probability mass per bin
* **Y-axis Scale:** Logarithmic, with markers at 10<sup>-4</sup>, 10<sup>-3</sup>, and 10<sup>-2</sup>.
* **X-axis:** Implicitly represents sorted bins, but there is no explicit label or scale.
* **Legend:** Located in the bottom-right corner.
* **Target uniform distribution:** Represented by a dashed blue line.
* **CoT with 90 steps:** Represented by solid blue bars.
* **Looped TF with 90 loops:** Represented by solid tan bars.
### Detailed Analysis
* **Target uniform distribution:** A horizontal dashed blue line at approximately 0.01 (10<sup>-2</sup>).
* **CoT with 90 steps:** Solid blue bars. The bars are mostly uniform, clustered around the 0.01 (10<sup>-2</sup>) level.
* **Looped TF with 90 loops:** Solid tan bars. The bars are concentrated on the left side of the chart, with a few bars reaching up to approximately 0.02 (2 * 10<sup>-2</sup>). The height of the bars decreases rapidly as you move to the right.
**Specific Values (Approximate):**
* **Target uniform distribution:** Constant at approximately 0.01 (10<sup>-2</sup>).
* **CoT with 90 steps:** Most bars are close to 0.01 (10<sup>-2</sup>).
* **Looped TF with 90 loops:**
* First bar: Approximately 0.02 (2 * 10<sup>-2</sup>).
* Second bar: Approximately 0.0015 (1.5 * 10<sup>-3</sup>).
* Subsequent bars decrease rapidly, reaching approximately 0.0001 (10<sup>-4</sup>) within the first few bins.
**Trends:**
* The "Target uniform distribution" is constant across all bins.
* The "CoT with 90 steps" distribution is relatively uniform, close to the target distribution.
* The "Looped TF with 90 loops" distribution is highly non-uniform, with a concentration of probability mass in the first few bins.
### Key Observations
* The "CoT with 90 steps" method produces a distribution that is much closer to the "Target uniform distribution" than the "Looped TF with 90 loops" method.
* The "Looped TF with 90 loops" method exhibits a highly skewed distribution, indicating that it favors certain graph colorings over others.
### Interpretation
The chart compares the distributions of graph colorings generated by two different methods ("CoT with 90 steps" and "Looped TF with 90 loops") against a target uniform distribution. The "CoT with 90 steps" method appears to be more successful in generating a uniform distribution of graph colorings, as its distribution closely matches the target. In contrast, the "Looped TF with 90 loops" method produces a distribution that is far from uniform, suggesting that it is biased towards certain colorings. This indicates that the "CoT with 90 steps" method is a better approach for generating unbiased samples of graph colorings.