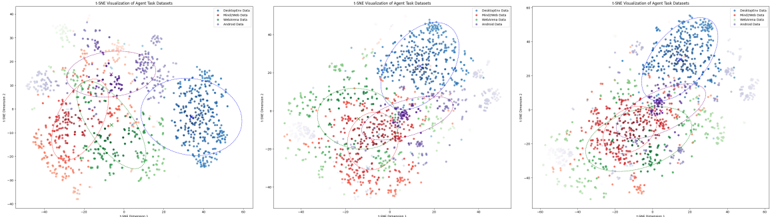
# Technical Document Extraction: t-SNE Visualization of Agent Task Datasets
This document provides a comprehensive extraction and analysis of three t-SNE (t-distributed Stochastic Neighbor Embedding) scatter plots. These plots visualize the high-dimensional feature space of four distinct agent task datasets.
## 1. General Metadata (Common to all three charts)
* **Title:** t-SNE Visualization of Agent Task Datasets
* **X-Axis Label:** t-SNE Dimension 1
* **Y-Axis Label:** t-SNE Dimension 2
* **Legend Location:** Top-right corner of each plot.
* **Legend Categories & Color Mapping:**
* **DesktopEnv Data:** Blue (Square marker)
* **Mind2Web Data:** Red (Circle marker)
* **WebArena Data:** Green (Cross/X marker)
* **Android Data:** Purple (Diamond marker)
* **Visual Overlays:** Each plot contains colored ellipses (confidence intervals or cluster boundaries) corresponding to the colors of the four data categories.
---
## 2. Component Isolation and Analysis
The image consists of three panels (Left, Center, Right) representing different stages or variations of the t-SNE embedding.
### Panel 1: Left Chart (Initial/High Separation)
* **Axis Scales:**
* X-axis: -60 to 60
* Y-axis: -40 to 40
* **Spatial Distribution & Trends:**
* **DesktopEnv (Blue):** Forms a distinct, dense cluster on the far right of the plot (X: 20 to 60, Y: -20 to 20). It has the least overlap with other datasets.
* **Android (Purple):** Located in the upper-middle region (X: -20 to 20, Y: 10 to 35). It shows moderate separation but is adjacent to WebArena.
* **Mind2Web (Red):** Located on the left side (X: -50 to -10, Y: -30 to 10). It shows significant internal variance but remains largely separated from DesktopEnv.
* **WebArena (Green):** Occupies the lower-middle region (X: -30 to 10, Y: -30 to 10). It shows the most overlap with Mind2Web (Red).
* **Trend Verification:** The clusters are relatively isolated, suggesting high feature distinctness between the environments in this specific embedding.
### Panel 2: Center Chart (Moderate Convergence)
* **Axis Scales:**
* X-axis: -40 to 40
* Y-axis: -40 to 40
* **Spatial Distribution & Trends:**
* **DesktopEnv (Blue):** Shifted to the upper-right quadrant (X: 0 to 30, Y: 10 to 45).
* **Android (Purple):** Now appears as a smaller, tighter cluster near the center/origin (X: 10 to 20, Y: -10 to 10), showing closer proximity to the other three groups.
* **Mind2Web (Red):** Centered in the lower-middle (X: -20 to 10, Y: -40 to 0).
* **WebArena (Green):** Located in the middle-left (X: -40 to 0, Y: -10 to 20).
* **Trend Verification:** The clusters are moving closer together compared to the first panel. The ellipses show increased overlap, particularly between WebArena (Green) and Mind2Web (Red).
### Panel 3: Right Chart (High Convergence/Overlap)
* **Axis Scales:**
* X-axis: -50 to 50
* Y-axis: -40 to 60
* **Spatial Distribution & Trends:**
* **DesktopEnv (Blue):** Remains in the upper-right (X: 0 to 40, Y: 20 to 60).
* **Android (Purple):** Highly concentrated in a small central "bridge" area (X: 0 to 15, Y: 0 to 15), overlapping with the edges of all other clusters.
* **Mind2Web (Red):** Occupies the lower-left quadrant (X: -40 to 10, Y: -30 to 10).
* **WebArena (Green):** Spread across the bottom and middle-left, showing significant intermingling with Mind2Web.
* **Trend Verification:** This panel represents the highest degree of feature similarity or a more compressed embedding. The "Android" data acts as a central hub between the more specialized web and desktop environments.
---
## 3. Data Summary Table (Estimated Centroids)
| Dataset | Color | Panel 1 (L) Approx. Center [x, y] | Panel 2 (C) Approx. Center [x, y] | Panel 3 (R) Approx. Center [x, y] |
| :--- | :--- | :--- | :--- | :--- |
| **DesktopEnv** | Blue | [40, 0] | [15, 30] | [20, 40] |
| **Mind2Web** | Red | [-35, -10] | [-5, -20] | [-15, -15] |
| **WebArena** | Green | [-15, -15] | [-20, 5] | [-10, -10] |
| **Android** | Purple | [0, 25] | [15, 0] | [10, 5] |
## 4. Conclusion
The visualizations demonstrate the relational mapping of four agent task datasets. **DesktopEnv** consistently remains the most distinct cluster. **Mind2Web** and **WebArena** (both web-based) show the highest degree of similarity and overlap across all three views. **Android** data serves as a transitional feature set that shares characteristics with both desktop and web environments.