\n
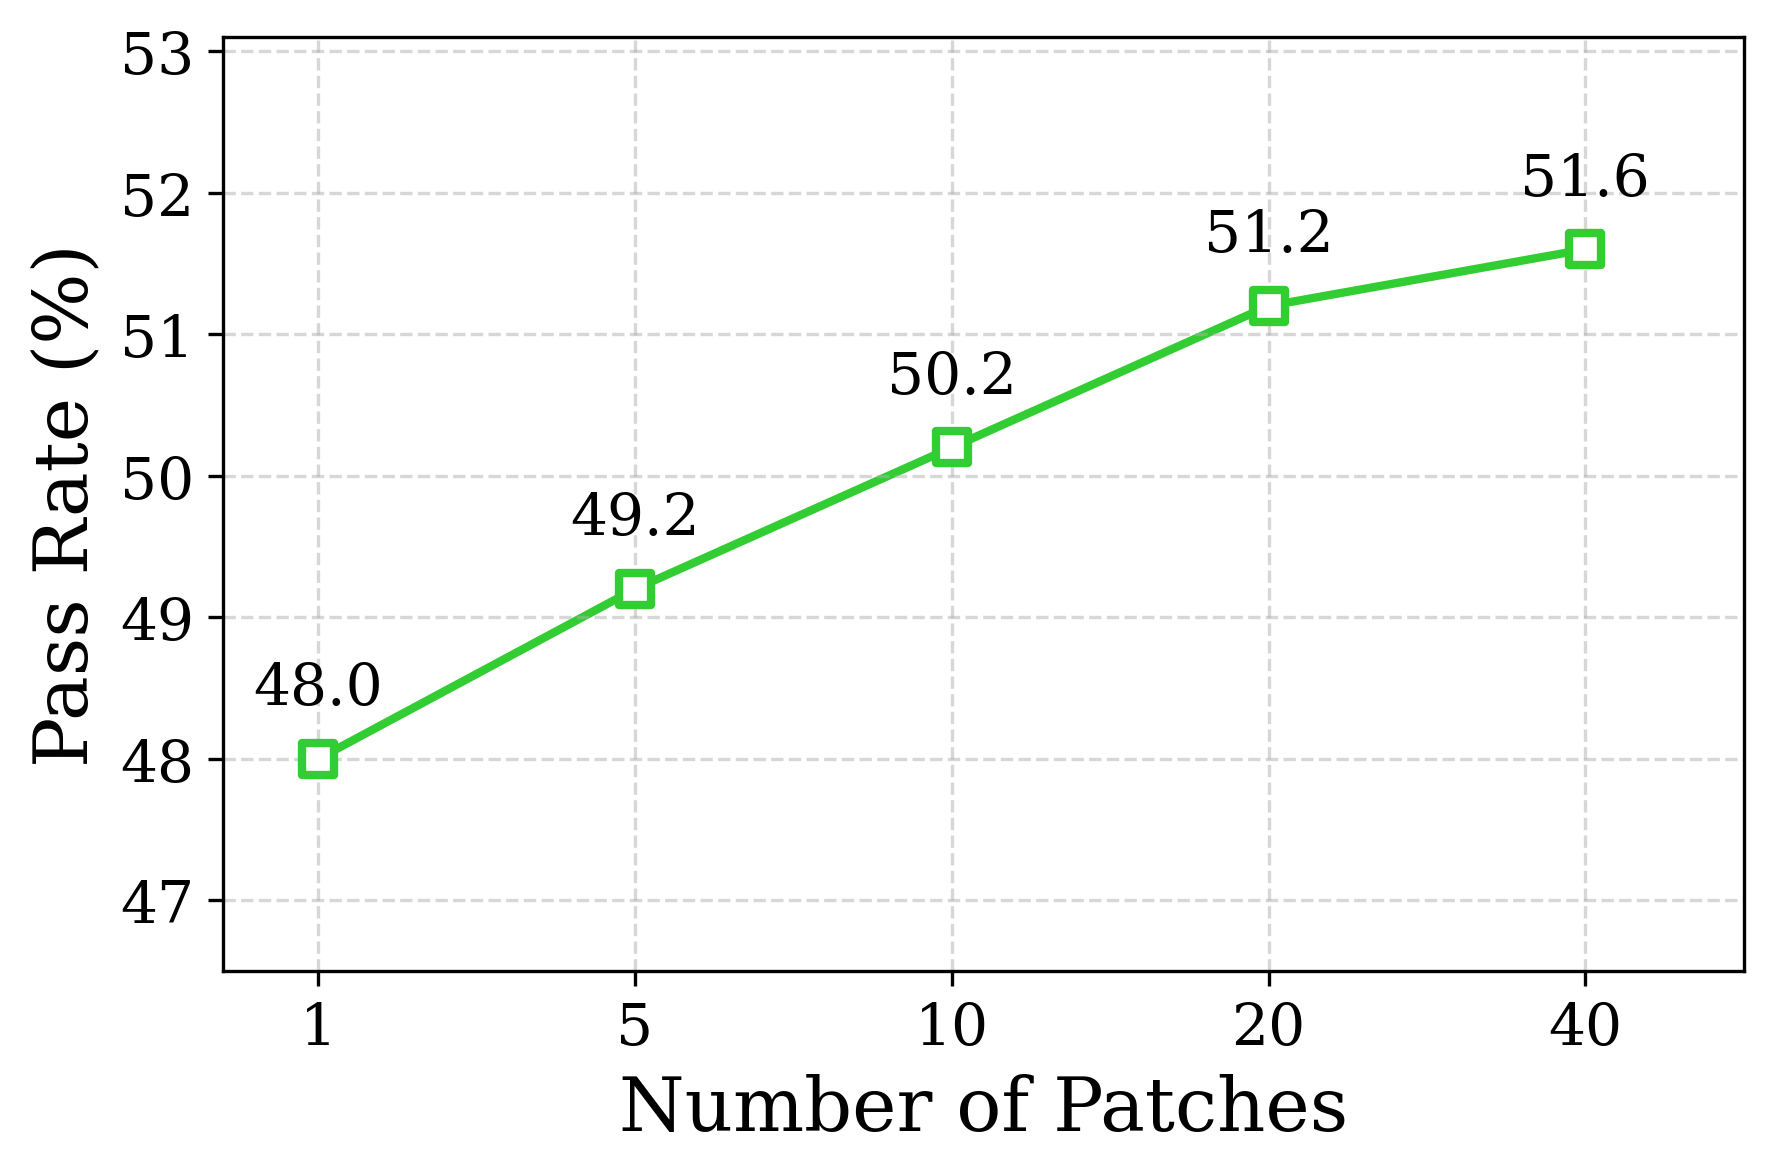
## Line Chart: Pass Rate vs. Number of Patches
### Overview
The image presents a line chart illustrating the relationship between the number of patches applied and the resulting pass rate, expressed as a percentage. The chart shows a generally increasing trend, suggesting that applying more patches leads to a higher pass rate.
### Components/Axes
* **X-axis:** Labeled "Number of Patches". The scale ranges from 1 to 40, with markers at 1, 5, 10, 20, and 40.
* **Y-axis:** Labeled "Pass Rate (%)". The scale ranges from 47 to 53, with markers at 47, 48, 49, 50, 51, 52, and 53.
* **Data Series:** A single green line representing the pass rate.
* **Data Points:** Square markers are placed at each data point along the line, with the corresponding pass rate value displayed next to each marker.
### Detailed Analysis
The data series shows an upward trend. Let's examine the specific data points:
* **Number of Patches = 1:** Pass Rate = 48.0%
* **Number of Patches = 5:** Pass Rate = 49.2%
* **Number of Patches = 10:** Pass Rate = 50.2%
* **Number of Patches = 20:** Pass Rate = 51.2%
* **Number of Patches = 40:** Pass Rate = 51.6%
The line slopes upward, indicating a positive correlation between the number of patches and the pass rate. The increase in pass rate appears to diminish as the number of patches increases, suggesting a potential saturation point.
### Key Observations
* The pass rate increases from 48.0% to 51.6% as the number of patches increases from 1 to 40.
* The largest increase in pass rate occurs between 10 and 20 patches (an increase of 1.0%).
* The smallest increase in pass rate occurs between 20 and 40 patches (an increase of 0.4%).
### Interpretation
The data suggests that applying patches improves the pass rate, likely by addressing vulnerabilities or bugs. However, the diminishing returns observed at higher patch counts indicate that there's a point where additional patches provide only marginal improvements. This could be due to several factors:
* **Diminishing Returns:** The most critical issues are likely addressed by the initial patches, leaving only less impactful issues to be resolved by subsequent patches.
* **Patch Interactions:** Applying too many patches could introduce conflicts or unintended side effects, potentially offsetting some of the benefits.
* **Testing Limitations:** The pass rate metric may not capture all aspects of system quality, and further testing may be needed to assess the overall impact of patches.
The chart highlights the importance of a balanced patching strategy, where the benefits of applying additional patches are weighed against the potential costs and risks. Further investigation could explore the types of patches applied and their specific impact on the pass rate to gain a more nuanced understanding of the relationship.