## Line Graphs: Response Functions Q*(v) and R*₂ vs. α and v
### Overview
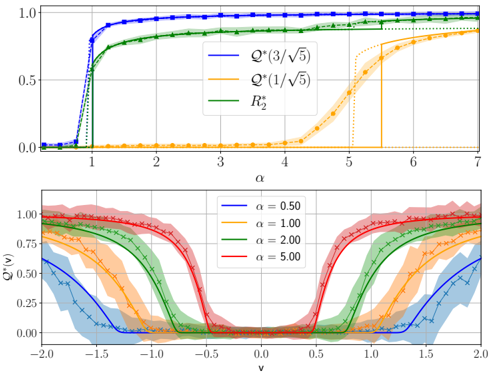
The image contains two line graphs. The top graph plots three response functions (Q*(3/√5), Q*(1/√5), R*₂) against parameter α (0–7). The bottom graph shows Q*(v) for four α values (-2.0 to 2.0) with shaded confidence intervals. Both graphs exhibit threshold-like behaviors and inverse relationships between parameters.
### Components/Axes
**Top Graph:**
- **X-axis (α):** Labeled "α", linear scale from 0 to 7.
- **Y-axis (Q*(v)):** Labeled "Q*(v)", linear scale from 0 to 1.
- **Legend:**
- Blue: Q*(3/√5)
- Orange: Q*(1/√5)
- Green: R*₂
- **Annotations:** Dashed vertical line at α=5 (orange line).
**Bottom Graph:**
- **X-axis (v):** Labeled "v", linear scale from -2.0 to 2.0.
- **Y-axis (Q*(v)):** Labeled "Q*(v)", linear scale from 0 to 1.
- **Legend:**
- Blue: α = -2.0
- Orange: α = -1.0
- Green: α = 0.0
- Red: α = 2.0
- **Annotations:** Shaded confidence intervals around each line.