## Bar Chart: Percentage of Image/Text Tokens by Expert and Layer
### Overview
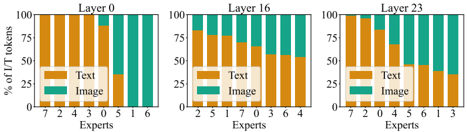
The image presents three bar charts, each representing a different layer (0, 16, and 23). Each chart shows the percentage of Image and Text tokens for different "Experts" (numbered 0-7). The y-axis represents the percentage of Image/Text tokens, ranging from 0% to 100%. The x-axis represents the different experts.
### Components/Axes
* **Titles:**
* Top-left chart: "Layer 0"
* Top-middle chart: "Layer 16"
* Top-right chart: "Layer 23"
* **Y-axis:** "% of I/T tokens" (ranging from 0 to 100 in increments of 25)
* **X-axis:** "Experts" (categorical, numbered differently for each layer)
* **Legend:** Located within each chart.
* Orange: "Text"
* Teal: "Image"
### Detailed Analysis
**Layer 0**
* Experts (x-axis): 7, 2, 4, 3, 0, 5, 1, 6
* Trend: Experts 7, 2, 4, 3, and 0 are dominated by Text tokens. Experts 5, 1, and 6 are dominated by Image tokens.
* Data Points:
* Expert 7: Text ~100%, Image ~0%
* Expert 2: Text ~100%, Image ~0%
* Expert 4: Text ~100%, Image ~0%
* Expert 3: Text ~100%, Image ~0%
* Expert 0: Text ~90%, Image ~10%
* Expert 5: Text ~30%, Image ~70%
* Expert 1: Text ~0%, Image ~100%
* Expert 6: Text ~0%, Image ~100%
**Layer 16**
* Experts (x-axis): 2, 5, 1, 7, 0, 3, 6, 4
* Trend: Experts 2, 5, 1, 7, 0, 3, 6, and 4 have a mix of Text and Image tokens.
* Data Points:
* Expert 2: Text ~80%, Image ~20%
* Expert 5: Text ~80%, Image ~20%
* Expert 1: Text ~75%, Image ~25%
* Expert 7: Text ~70%, Image ~30%
* Expert 0: Text ~65%, Image ~35%
* Expert 3: Text ~40%, Image ~60%
* Expert 6: Text ~30%, Image ~70%
* Expert 4: Text ~20%, Image ~80%
**Layer 23**
* Experts (x-axis): 7, 2, 0, 4, 5, 6, 1, 3
* Trend: Experts 7, 2, 0, 4, 5, 6, 1, and 3 have a mix of Text and Image tokens.
* Data Points:
* Expert 7: Text ~95%, Image ~5%
* Expert 2: Text ~90%, Image ~10%
* Expert 0: Text ~80%, Image ~20%
* Expert 4: Text ~60%, Image ~40%
* Expert 5: Text ~55%, Image ~45%
* Expert 6: Text ~30%, Image ~70%
* Expert 1: Text ~20%, Image ~80%
* Expert 3: Text ~20%, Image ~80%
### Key Observations
* In Layer 0, some experts are highly specialized in either Text or Image tokens.
* In Layers 16 and 23, the distribution of Text and Image tokens is more balanced across experts.
* The expert order on the x-axis changes between layers.
### Interpretation
The charts illustrate how different "experts" within a model (likely a neural network) process image and text tokens at different layers. Layer 0 shows a clear specialization, with some experts focusing almost exclusively on text and others on images. As the data progresses through the network (Layers 16 and 23), the experts become more balanced in their processing of both types of tokens. This suggests that the model is integrating information from both modalities as it goes deeper. The changing order of experts on the x-axis between layers might indicate a re-organization or re-weighting of expert contributions as the model processes the data.