\n
## Stacked Bar Charts: Percentage of L/T Tokens by Expert and Layer
### Overview
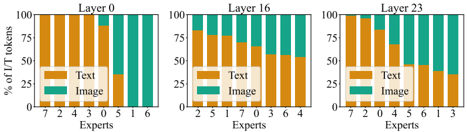
The image presents three stacked bar charts, each representing a different layer (0, 16, and 23) of a model. Each chart displays the percentage of L/T (likely Language/Text) tokens attributed to either "Image" or "Text" as assessed by different "Experts" (numbered 0 through 7). The charts visually compare the distribution of these token types across layers and expert opinions.
### Components/Axes
* **X-axis:** "Experts" - numbered 0 to 7.
* **Y-axis:** "% of L/T tokens" - ranging from 0% to 100%.
* **Stacked Bars:** Each bar represents an expert's assessment. The bars are divided into two segments:
* "Image" (represented by teal/green color)
* "Text" (represented by orange/yellow color)
* **Titles:** Each chart has a title indicating the layer number: "Layer 0", "Layer 16", "Layer 23".
* **Legend:** A small box in each chart identifies the colors corresponding to "Text" and "Image".
### Detailed Analysis or Content Details
**Layer 0:**
The chart for Layer 0 shows a relatively even distribution between "Image" and "Text" for most experts.
* Expert 7: Approximately 10% Image, 90% Text.
* Expert 2: Approximately 20% Image, 80% Text.
* Expert 4: Approximately 30% Image, 70% Text.
* Expert 3: Approximately 35% Image, 65% Text.
* Expert 0: Approximately 40% Image, 60% Text.
* Expert 5: Approximately 45% Image, 55% Text.
* Expert 1: Approximately 50% Image, 50% Text.
* Expert 6: Approximately 55% Image, 45% Text.
**Layer 16:**
The chart for Layer 16 shows a shift towards "Text" being more dominant for most experts.
* Expert 2: Approximately 0% Image, 100% Text.
* Expert 5: Approximately 10% Image, 90% Text.
* Expert 1: Approximately 20% Image, 80% Text.
* Expert 7: Approximately 25% Image, 75% Text.
* Expert 0: Approximately 30% Image, 70% Text.
* Expert 3: Approximately 40% Image, 60% Text.
* Expert 6: Approximately 50% Image, 50% Text.
* Expert 4: Approximately 60% Image, 40% Text.
**Layer 23:**
The chart for Layer 23 continues the trend of "Text" dominance, with even higher percentages for most experts.
* Expert 7: Approximately 0% Image, 100% Text.
* Expert 2: Approximately 10% Image, 90% Text.
* Expert 0: Approximately 20% Image, 80% Text.
* Expert 4: Approximately 30% Image, 70% Text.
* Expert 5: Approximately 35% Image, 65% Text.
* Expert 1: Approximately 40% Image, 60% Text.
* Expert 3: Approximately 45% Image, 55% Text.
* Expert 6: Approximately 50% Image, 50% Text.
### Key Observations
* **Trend:** As the layer number increases (0 -> 16 -> 23), the percentage of tokens attributed to "Text" generally increases, while the percentage attributed to "Image" decreases.
* **Expert Variability:** There is some variability in the assessments made by different experts, particularly in Layer 0.
* **Layer 23 Dominance:** In Layer 23, most experts assign a very high percentage (80% or more) of tokens to "Text".
### Interpretation
The data suggests that as the model progresses through deeper layers (from Layer 0 to Layer 23), it increasingly interprets the input as "Text" rather than "Image". This could indicate that the model is learning to abstract away from the raw visual features of the image and focus more on the textual information associated with it. The initial layers (Layer 0) show a more balanced view, likely reflecting the initial processing of the image's visual components. The increasing dominance of "Text" in later layers might be a consequence of the model's training objective or architecture, which may prioritize textual understanding. The variability among experts suggests that the distinction between "Image" and "Text" tokens is not always clear-cut and can be subject to interpretation. The charts provide a visual representation of how the model's internal representation of the input data changes as it processes information through different layers.