\n
## Grouped Bar Chart: LLM Model Performance Comparison
### Overview
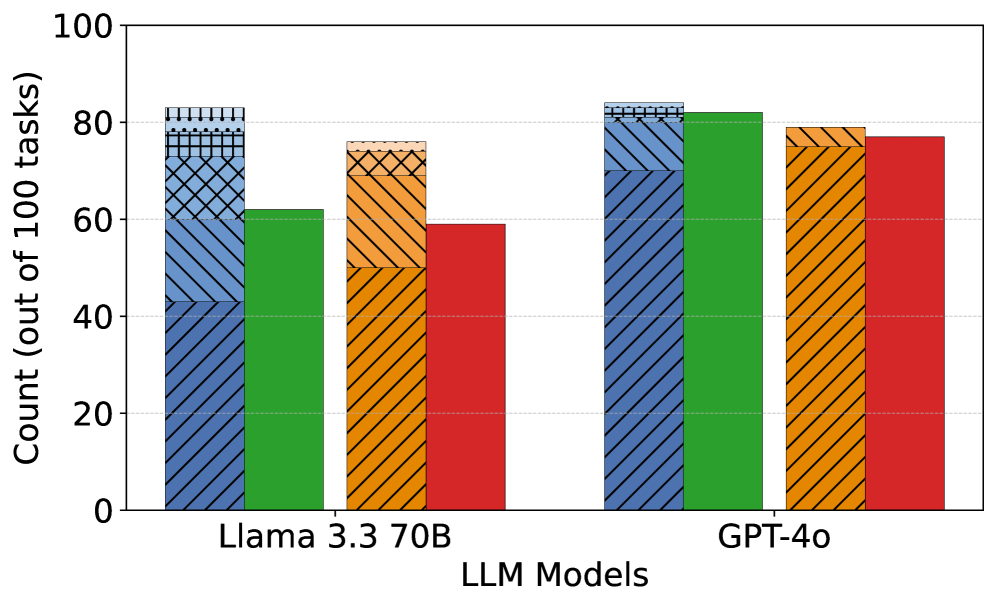
This image is a grouped bar chart comparing the performance of two Large Language Models (LLMs) on a set of 100 tasks. The chart displays four distinct performance metrics (represented by different colored and patterned bars) for each of the two models: "Llama 3.3 70B" and "GPT-4o". The y-axis represents the count of successful tasks out of 100.
### Components/Axes
* **Chart Type:** Grouped Bar Chart.
* **X-Axis (Horizontal):**
* **Label:** "LLM Models"
* **Categories:** Two primary categories are listed: "Llama 3.3 70B" (left group) and "GPT-4o" (right group).
* **Y-Axis (Vertical):**
* **Label:** "Count (out of 100 tasks)"
* **Scale:** Linear scale from 0 to 100, with major tick marks and grid lines at intervals of 20 (0, 20, 40, 60, 80, 100).
* **Data Series (Bars):** For each model, there are four bars. A legend is not present in the image, so the series are identified by their visual properties:
1. **Blue Bar with Diagonal Stripes (\\):** The leftmost bar in each group. It features a complex, layered pattern on its top section (approximately the top 10-15% of the bar), consisting of horizontal dots, a grid, and diagonal cross-hatching.
2. **Solid Green Bar:** The second bar from the left in each group.
3. **Orange Bar with Cross-Hatching (X):** The third bar from the left in each group.
4. **Solid Red Bar:** The rightmost bar in each group.
### Detailed Analysis
**Llama 3.3 70B (Left Group):**
* **Blue Bar (Diagonal Stripes):** Reaches a height of approximately **83**. The top patterned section is distinct.
* **Green Bar (Solid):** Reaches a height of approximately **62**.
* **Orange Bar (Cross-Hatching):** Reaches a height of approximately **76**.
* **Red Bar (Solid):** Reaches a height of approximately **59**.
**GPT-4o (Right Group):**
* **Blue Bar (Diagonal Stripes):** Reaches a height of approximately **83**, very similar to the Llama 3.3 70B blue bar. The top patterned section is also present.
* **Green Bar (Solid):** Reaches a height of approximately **82**.
* **Orange Bar (Cross-Hatching):** Reaches a height of approximately **79**.
* **Red Bar (Solid):** Reaches a height of approximately **77**.
**Trend Verification:**
* For the **Blue (striped)** series, both models show a similarly high performance (~83).
* For the **Green (solid)** series, GPT-4o (~82) shows a significantly higher performance than Llama 3.3 70B (~62).
* For the **Orange (cross-hatched)** series, GPT-4o (~79) performs slightly better than Llama 3.3 70B (~76).
* For the **Red (solid)** series, GPT-4o (~77) shows a notably higher performance than Llama 3.3 70B (~59).
### Key Observations
1. **Performance Gap:** GPT-4o outperforms Llama 3.3 70B in three out of the four measured categories (Green, Orange, Red). The performance gap is most pronounced in the Green and Red categories.
2. **Parity in One Category:** The models perform almost identically in the category represented by the Blue (striped) bar.
3. **Internal Model Consistency:** For Llama 3.3 70B, there is a wider spread in performance across categories (from ~59 to ~83). For GPT-4o, the performance is more consistent and clustered at a higher level (from ~77 to ~83).
4. **Visual Anomaly:** The Blue bars for both models have a unique, complex pattern at their top, which is not present on any other bars. This likely signifies a special condition, sub-category, or stacked data element for that specific metric, but its meaning cannot be determined without a legend.
### Interpretation
The chart provides a comparative snapshot of task success rates for two prominent LLMs. The data suggests that **GPT-4o demonstrates stronger and more consistent overall performance** across the evaluated task suite compared to Llama 3.3 70B.
The near-identical score on the "Blue" metric indicates that for that specific type of task (whatever it represents), the models are equally capable. However, GPT-4o's substantial leads in the "Green" and "Red" metrics point to superior capabilities in those particular domains or under those specific evaluation conditions.
The lack of a legend is a critical omission for full technical understanding. The distinct patterns, especially the layered design on the Blue bars, imply the data is more complex than simple counts—possibly representing stacked successes, different difficulty tiers, or sub-task breakdowns. Without this key, the precise nature of the four compared metrics remains unknown, limiting the interpretation to relative performance trends rather than absolute categorical analysis. To fully leverage this chart, one would need the accompanying legend to decode what the Blue, Green, Orange, and Red bars specifically measure.