\n
## Scatter Plot: Accuracy vs. Time-to-Answer
### Overview
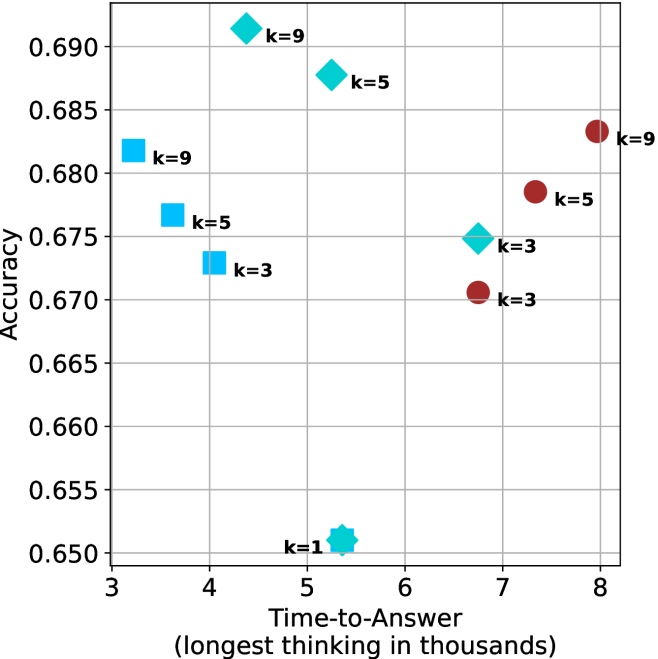
This image presents a scatter plot illustrating the relationship between Accuracy and Time-to-Answer (measured in thousands of seconds) for different values of 'k'. The data points are color-coded to represent different 'k' values.
### Components/Axes
* **X-axis:** Time-to-Answer (longest thinking in thousands) - Scale ranges from approximately 3 to 8.5.
* **Y-axis:** Accuracy - Scale ranges from approximately 0.65 to 0.695.
* **Data Points:** Scatter plot points, colored as follows:
* Red: k=9
* Dark Turquoise: k=1
* Blue: k=3
* Green: k=5
* Cyan: k=9
* **Labels:** Each data point is labeled with its corresponding 'k' value.
### Detailed Analysis
The plot contains data points for k=1, k=3, k=5, and k=9.
* **k=1:** One data point at approximately (3.5, 0.65).
* **k=3:** Two data points: one at approximately (4.2, 0.67) and another at approximately (7.2, 0.67).
* **k=5:** Two data points: one at approximately (4.5, 0.685) and another at approximately (7.7, 0.675).
* **k=9:** Three data points: one at approximately (3.8, 0.68), another at approximately (5.2, 0.69), and a third at approximately (8.2, 0.685).
**Trends:**
* **k=1:** The trend is flat, with only one data point.
* **k=3:** The data points show a slight upward trend as Time-to-Answer increases.
* **k=5:** The data points show a slight downward trend as Time-to-Answer increases.
* **k=9:** The data points show a generally flat trend, with some variation.
### Key Observations
* There are multiple data points for k=3, k=5, and k=9, suggesting multiple trials or observations for these values.
* The highest accuracy values are generally associated with k=5 and k=9.
* The data for k=1 is limited to a single point, making it difficult to draw conclusions.
* There is some overlap in the accuracy values for different 'k' values, particularly between k=3, k=5, and k=9.
### Interpretation
The data suggests that the relationship between accuracy and time-to-answer is dependent on the value of 'k'. For k=3, there is a slight positive correlation between time-to-answer and accuracy. For k=5, there is a slight negative correlation. For k=9, the relationship is less clear. The optimal value of 'k' for maximizing accuracy appears to be around 5 or 9, but further investigation is needed to determine the best value. The spread of data points for k=3, k=5, and k=9 indicates variability in the results, which could be due to factors not accounted for in this analysis. The single data point for k=1 is insufficient to draw any meaningful conclusions. The plot demonstrates a trade-off between time-to-answer and accuracy, as longer thinking times do not necessarily lead to higher accuracy.