## Scatter Plot: Accuracy vs. Time-to-Answer for Different k Values
### Overview
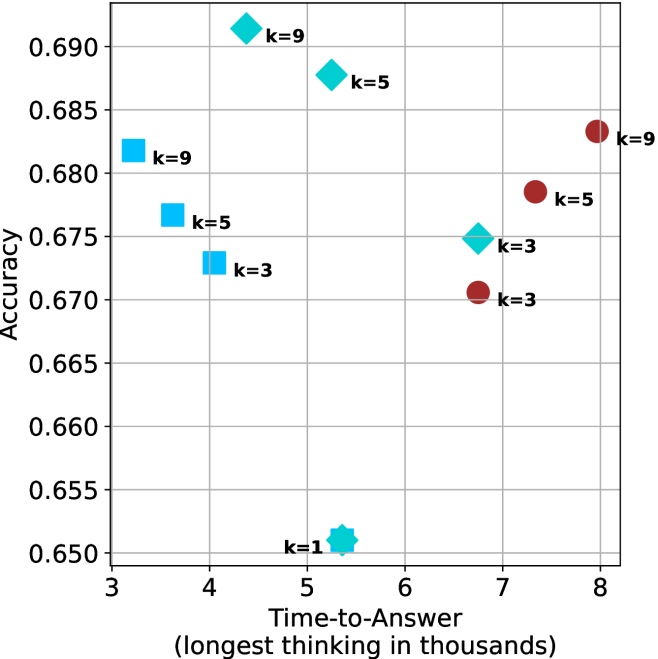
The image is a scatter plot comparing classification accuracy (y-axis) against time-to-answer (x-axis, in thousands of units) for different model configurations labeled by k values (k=1, k=3, k=5, k=9). Data points are color-coded and shaped by k value, with a clear trend showing higher k values generally achieving better accuracy at the cost of longer processing time.
### Components/Axes
- **Y-axis (Accuracy)**: Ranges from 0.650 to 0.690 in increments of 0.005.
- **X-axis (Time-to-Answer)**: Ranges from 3 to 8 (in thousands), labeled as "Time-to-Answer (longest thinking in thousands)".
- **Legend**: Located on the right side of the plot, with four entries:
- **k=1**: Teal hexagon (⭐)
- **k=3**: Blue square (■)
- **k=5**: Green diamond (◇)
- **k=9**: Red circle (●)
- **Axis Labels**:
- Y-axis: "Accuracy"
- X-axis: "Time-to-Answer (longest thinking in thousands)"
### Detailed Analysis
- **k=1 (Teal Hexagon)**:
- Single data point at (5.2, 0.650).
- Lowest accuracy and shortest time-to-answer.
- **k=3 (Blue Square)**:
- Three data points:
- (4.0, 0.675)
- (4.5, 0.670)
- (7.0, 0.670)
- Moderate accuracy with mid-range time-to-answer.
- **k=5 (Green Diamond)**:
- Three data points:
- (4.8, 0.685)
- (5.5, 0.685)
- (6.5, 0.675)
- Highest accuracy among mid-range k values, with slightly longer time-to-answer than k=3.
- **k=9 (Red Circle)**:
- Three data points:
- (4.0, 0.680)
- (7.0, 0.685)
- (8.0, 0.685)
- Highest accuracy overall, with the longest time-to-answer.
### Key Observations
1. **Accuracy-Time Tradeoff**: Higher k values (k=5, k=9) consistently achieve higher accuracy but require significantly more time-to-answer.
2. **Outlier Behavior**: The k=1 data point (5.2, 0.650) deviates from the trend, showing the lowest accuracy despite a mid-range time-to-answer.
3. **Clustering**: k=3 and k=5 data points cluster in the mid-range of the x-axis, while k=9 spans both mid and high x-axis values.
4. **Redundancy**: k=9 has two identical accuracy values (0.685) at x=7 and x=8, suggesting potential model stability at longer processing times.
### Interpretation
The data demonstrates a clear inverse relationship between model complexity (k) and efficiency. While increasing k improves accuracy, it does so at the expense of computational time. The k=9 configuration achieves the highest accuracy (0.685) but requires the longest processing time (8,000 units). The k=1 outlier suggests that simpler models may underperform even when given moderate computational resources. This tradeoff highlights the need to balance model complexity with practical constraints in real-world applications. The clustering of k=3 and k=5 points in the mid-range suggests these configurations might offer a reasonable compromise between accuracy and efficiency for many use cases.