# Technical Document Extraction: Distribution of ROUGE-L Scores
## Header
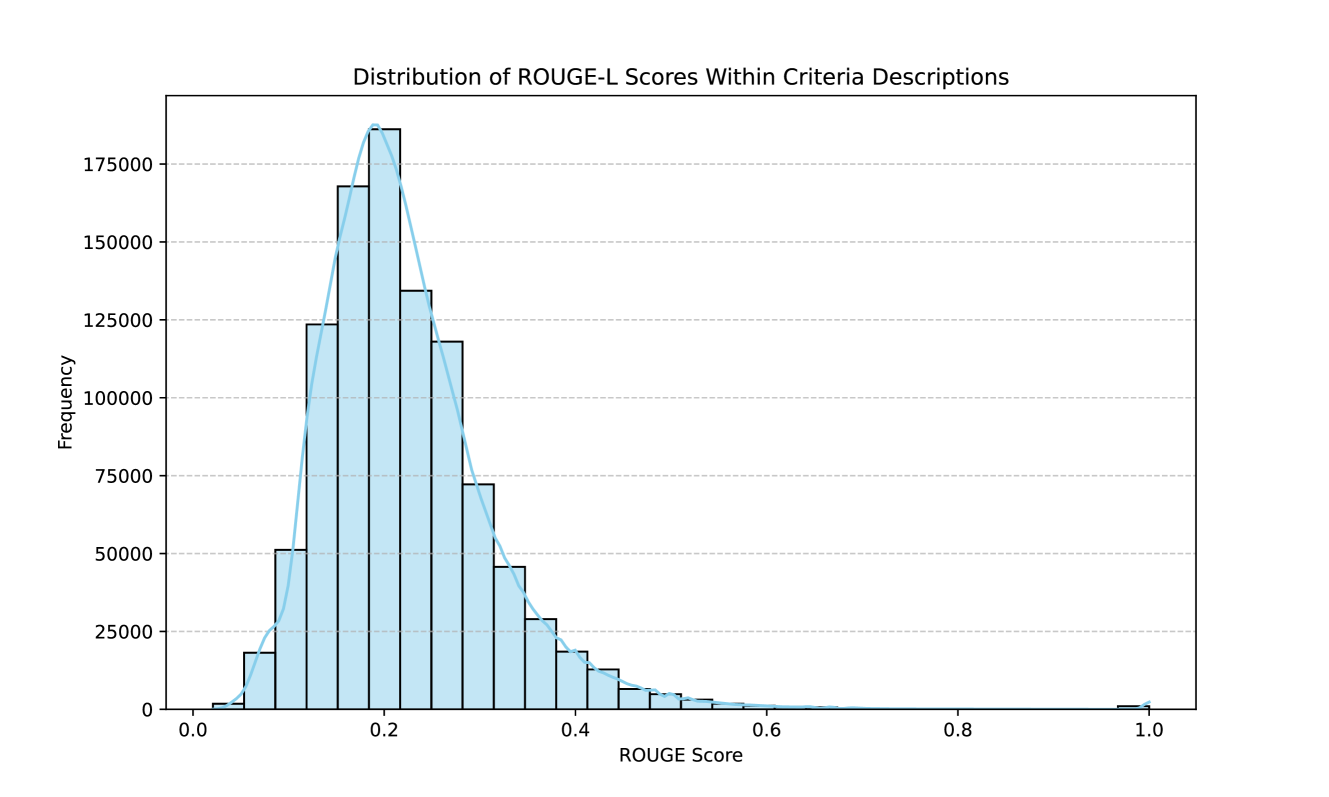
- **Title**: "Distribution of ROUGE-L Scores Within Criteria Descriptions"
## Main Chart
### Axes
- **X-Axis (Horizontal)**:
- **Label**: "ROUGE Score"
- **Range**: 0.0 to 1.0
- **Tick Marks**: 0.0, 0.2, 0.4, 0.6, 0.8, 1.0
- **Y-Axis (Vertical)**:
- **Label**: "Frequency"
- **Range**: 0 to 180,000
- **Tick Marks**: 0, 25,000, 50,000, 75,000, 100,000, 125,000, 150,000, 175,000, 180,000
### Chart Components
- **Bars**:
- **Color**: Blue
- **Distribution**:
- **Peak**: At ROUGE Score ~0.2 with frequency ~180,000
- **Trend**: Right-skewed distribution (frequencies decrease as ROUGE Score increases)
- **Secondary Peak**: Small spike near ROUGE Score ~1.0 (~2,000 frequency)
- **Overlay Curve**:
- **Color**: Blue (matches bar color)
- **Type**: Normal distribution curve
- **Alignment**: Peaks at ~0.2, follows general trend of bar distribution
### Legend
- **Placement**: Not explicitly visible in the image
- **Color Reference**: Blue (bars and curve share the same color; no distinct legend entries)
## Footer
- **No explicit footer content** visible in the image.
## Key Trends and Data Points
1. **Primary Distribution**:
- **Mode**: ROUGE Score ~0.2 (highest frequency: ~180,000)
- **Decline**: Frequency drops sharply after 0.2, reaching ~50,000 at 0.4 and ~10,000 at 0.6
2. **Secondary Peak**:
- **Location**: Near ROUGE Score ~1.0
- **Frequency**: ~2,000 (outlier compared to main distribution)
3. **Skewness**:
- Right-skewed distribution (long tail toward higher ROUGE Scores)
## Verification
- **Trend Consistency**: Overlay curve aligns with bar distribution, confirming normal distribution approximation.
- **Color Matching**: All elements (bars, curve) use blue; no discrepancies in legend references.
## Notes
- No additional textual data, tables, or embedded descriptions present.
- No other languages detected in the image.