\n
## Violin Plots: Comparison of Capacity Factors from Different Models
### Overview
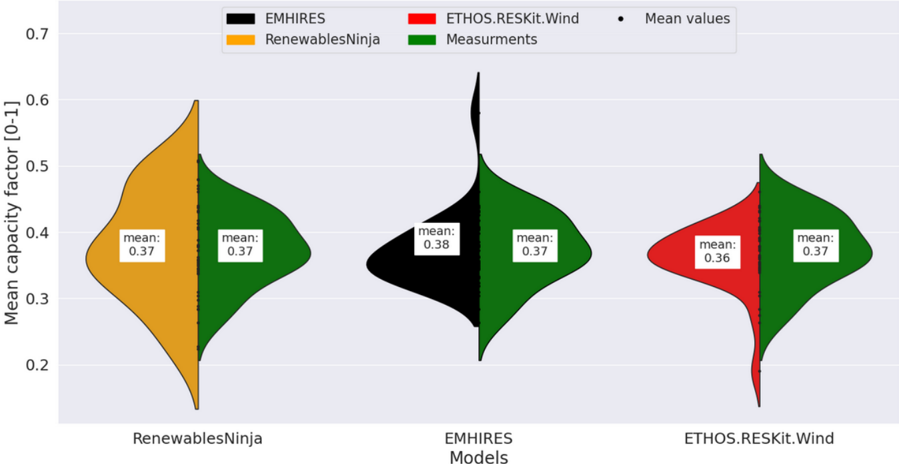
The image presents three violin plots comparing the distribution of mean capacity factors obtained from three different models: RenewablesNinja, EMHIRES, and ETHOS.RESKit.Wind. Each plot also includes a representation of measurements. The plots visually display the range, median, and density of the capacity factor data for each model.
### Components/Axes
* **X-axis:** Models - RenewablesNinja, EMHIRES, ETHOS.RESKit.Wind
* **Y-axis:** Mean capacity factor [0-1]. Scale ranges from approximately 0.2 to 0.7.
* **Legend:** Located at the top-right corner.
* Black: EMHIRES
* Yellow: RenewablesNinja
* Red: ETHOS.RESKit.Wind
* Green: Measurements
* Black dots: Mean values
* Each violin plot displays the distribution of capacity factors.
* A "mean" label with the approximate mean value is displayed within each violin plot.
### Detailed Analysis
**1. RenewablesNinja:**
* The violin plot is yellow.
* The distribution is wide, ranging from approximately 0.22 to 0.58.
* The median appears to be around 0.38.
* The mean value is labeled as 0.37.
* The green "Measurements" data points are clustered around 0.37.
**2. EMHIRES:**
* The violin plot is black.
* The distribution is relatively narrow, ranging from approximately 0.28 to 0.48.
* The median appears to be around 0.37.
* The mean value is labeled as 0.38.
* The green "Measurements" data points are clustered around 0.37.
**3. ETHOS.RESKit.Wind:**
* The violin plot is red.
* The distribution is wide, ranging from approximately 0.22 to 0.62.
* The median appears to be around 0.36.
* The mean value is labeled as 0.36.
* The green "Measurements" data points are clustered around 0.37.
* Black dots representing mean values are visible within the violin plot.
### Key Observations
* All three models have mean capacity factors around 0.36-0.38.
* RenewablesNinja and ETHOS.RESKit.Wind exhibit wider distributions of capacity factors compared to EMHIRES.
* The measurements are consistently around 0.37 for all three models.
* The distributions of the models are not symmetrical.
### Interpretation
The violin plots demonstrate a comparison of the capacity factor distributions generated by three different wind energy models and measured data. While the mean capacity factors are similar across all models (around 0.37), the spread of the distributions varies. EMHIRES shows the most concentrated distribution, suggesting a more consistent prediction of capacity factors. RenewablesNinja and ETHOS.RESKit.Wind have wider distributions, indicating greater uncertainty or variability in their predictions. The consistency of the measurements (around 0.37) across all models suggests that the models are generally capturing the overall capacity factor, but differ in how they represent the range of possible values. The asymmetry of the distributions suggests that the capacity factors are not normally distributed, and may be skewed towards lower values. This could be due to factors such as wind intermittency or turbine downtime. The fact that the mean values are close to the measurements suggests that the models are reasonably calibrated, but the differences in distribution width highlight the varying levels of uncertainty associated with each model.