## Line Chart: Performance Scaling of Stencil Configurations
### Overview
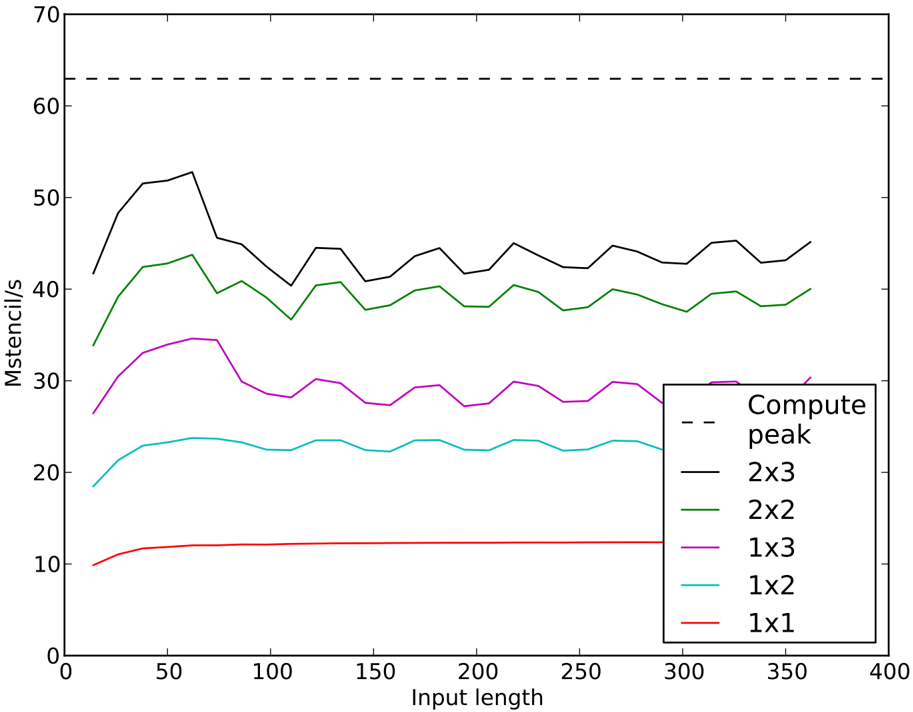
This image is a line chart illustrating the performance (measured in Mstencil/s) of various stencil configurations (2x3, 2x2, 1x3, 1x2, 1x1) against varying input lengths. It also includes a reference line for the theoretical "Compute peak." The chart demonstrates that performance is highly dependent on the configuration size and exhibits periodic oscillations as the input length increases.
### Components/Axes
* **X-Axis:** Labeled "Input length," ranging from 0 to 400 in increments of 50.
* **Y-Axis:** Labeled "Mstencil/s," ranging from 0 to 70 in increments of 10.
* **Legend:** Located in the bottom-right quadrant of the chart area.
* **Compute peak:** Dashed black line.
* **2x3:** Solid black line.
* **2x2:** Solid green line.
* **1x3:** Solid magenta (purple) line.
* **1x2:** Solid cyan (light blue) line.
* **1x1:** Solid red line.
### Detailed Analysis
#### Trend Verification
* **Compute peak (Dashed):** A perfectly horizontal line at approximately 63 Mstencil/s.
* **2x3 (Black):** Starts at ~42, rises to a peak of ~53 at input length 60, then drops and enters a periodic oscillation pattern between ~40 and ~45 Mstencil/s.
* **2x2 (Green):** Starts at ~34, rises to a peak of ~44 at input length 60, then enters a periodic oscillation pattern between ~37 and ~41 Mstencil/s.
* **1x3 (Magenta):** Starts at ~26, rises to a peak of ~35 at input length 60, then enters a periodic oscillation pattern between ~27 and ~30 Mstencil/s.
* **1x2 (Cyan):** Starts at ~18, rises to a peak of ~24 at input length 60, then enters a periodic oscillation pattern between ~22 and ~24 Mstencil/s.
* **1x1 (Red):** Starts at ~10, rises rapidly to ~12 by input length 40, and remains nearly flat at ~12.5 Mstencil/s for the remainder of the range.
#### Data Points (Approximate)
| Input Length | 2x3 (Black) | 2x2 (Green) | 1x3 (Magenta) | 1x2 (Cyan) | 1x1 (Red) |
| :--- | :--- | :--- | :--- | :--- | :--- |
| **~10** | ~42 | ~34 | ~26 | ~18 | ~10 |
| **~60 (Peak)** | ~53 | ~44 | ~35 | ~24 | ~12 |
| **~110 (Trough)**| ~40 | ~37 | ~28 | ~22 | ~12.5 |
| **~130 (Peak)** | ~45 | ~41 | ~30 | ~23 | ~12.5 |
| **~150 (Trough)**| ~41 | ~38 | ~27 | ~22 | ~12.5 |
| **~180 (Peak)** | ~45 | ~40 | ~30 | ~23 | ~12.5 |
| **~200 (Trough)**| ~42 | ~38 | ~27 | ~22 | ~12.5 |
| **~240 (Peak)** | ~45 | ~40 | ~30 | ~23 | ~12.5 |
| **~250 (Trough)**| ~42 | ~38 | ~28 | ~22 | ~12.5 |
| **~310 (Peak)** | ~45 | ~40 | ~30 | ~23 | ~12.5 |
### Key Observations
1. **Universal "Hump":** All configurations except 1x1 exhibit a significant performance spike at an input length of approximately 60.
2. **Periodic Oscillations:** After the initial rise, the 2x3, 2x2, 1x3, and 1x2 lines show a consistent "sawtooth" pattern. This suggests that performance is sensitive to specific input length alignments, likely related to cache line boundaries or vectorization block sizes.
3. **Configuration Scaling:** There is a clear correlation between the configuration size and throughput. The 2x3 configuration consistently outperforms the 2x2, which outperforms the 1x3, and so on.
4. **1x1 Anomaly:** The 1x1 configuration is the only one that does not exhibit the periodic oscillation pattern, suggesting it is likely limited by overhead or memory latency rather than the compute-bound factors affecting the larger configurations.
### Interpretation
The data suggests that the stencil computation is highly sensitive to input length, likely due to memory alignment or cache utilization. The periodic oscillations indicate that as the input length increases, the efficiency of the computation fluctuates based on how well the data fits into the processor's cache or vector registers.
The "Compute peak" line serves as a theoretical ceiling that none of the configurations reach, indicating that the system is likely memory-bandwidth bound or limited by instruction overhead rather than raw compute throughput. The 1x1 configuration is likely too small to trigger the specific optimization patterns (or cache-related penalties) seen in the larger configurations, resulting in a stable, low-performance baseline. The "hump" at input length 60 likely represents an optimal data size where the cache utilization is maximized before the periodic overheads begin to dominate.