## Line Chart: Mstencil/s vs. Input Length
### Overview
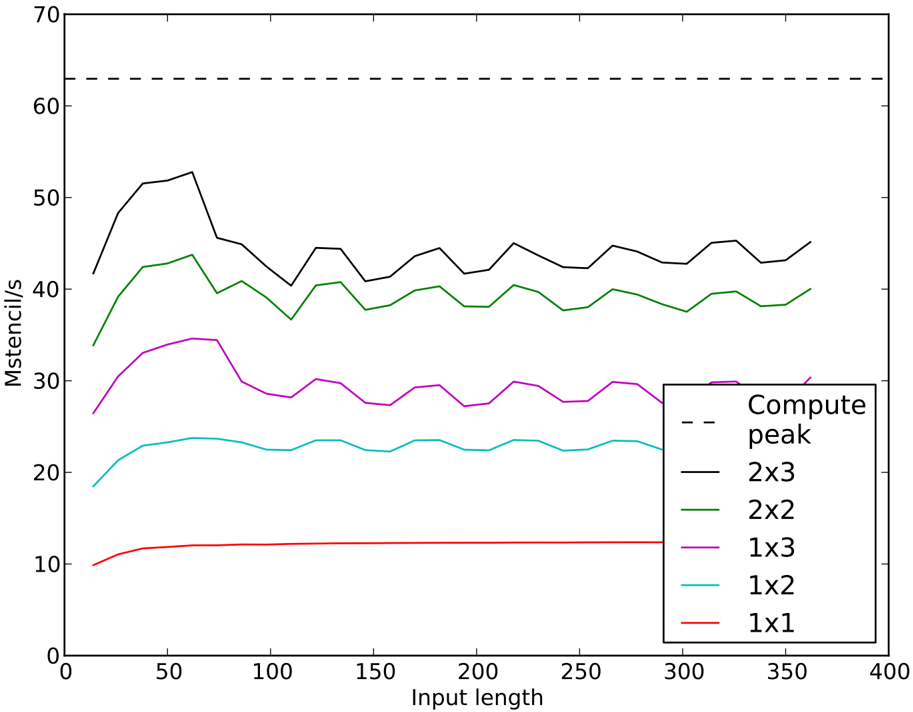
The image is a line chart comparing the performance (Mstencil/s) of different stencil configurations (2x3, 2x2, 1x3, 1x2, 1x1) against varying input lengths. A horizontal dashed line represents the "Compute peak".
### Components/Axes
* **X-axis:** Input length, ranging from 0 to 400.
* **Y-axis:** Mstencil/s, ranging from 0 to 70.
* **Legend:** Located on the right side of the chart.
* Compute peak (dashed black line)
* 2x3 (solid black line)
* 2x2 (solid green line)
* 1x3 (solid purple line)
* 1x2 (solid cyan line)
* 1x1 (solid red line)
### Detailed Analysis
* **Compute peak:** A horizontal dashed black line at approximately 63 Mstencil/s.
* **2x3 (Black Line):** Starts at approximately 42 Mstencil/s at input length 20, rises to a peak of approximately 53 Mstencil/s around input length 70, and then fluctuates between 40 and 45 Mstencil/s for the remaining input lengths.
* **2x2 (Green Line):** Starts at approximately 34 Mstencil/s at input length 20, rises to a peak of approximately 44 Mstencil/s around input length 70, and then fluctuates between 38 and 42 Mstencil/s for the remaining input lengths.
* **1x3 (Purple Line):** Starts at approximately 25 Mstencil/s at input length 20, rises to a peak of approximately 34 Mstencil/s around input length 60, and then fluctuates between 27 and 30 Mstencil/s for the remaining input lengths.
* **1x2 (Cyan Line):** Starts at approximately 18 Mstencil/s at input length 20, rises to a peak of approximately 24 Mstencil/s around input length 60, and then fluctuates between 22 and 24 Mstencil/s for the remaining input lengths.
* **1x1 (Red Line):** Starts at approximately 10 Mstencil/s at input length 20, rises to approximately 12 Mstencil/s around input length 50, and then remains relatively constant at approximately 12 Mstencil/s for the remaining input lengths.
### Key Observations
* The "Compute peak" represents an upper bound on performance.
* The 2x3 stencil configuration consistently achieves the highest Mstencil/s performance among the tested configurations.
* The 1x1 stencil configuration has the lowest Mstencil/s performance.
* All stencil configurations show an initial increase in performance with increasing input length, followed by a relatively stable performance after an input length of approximately 70.
* The performance of the 2x3, 2x2, 1x3, and 1x2 configurations fluctuates slightly with increasing input length after the initial rise.
### Interpretation
The chart illustrates the performance of different stencil configurations as a function of input length. The 2x3 configuration consistently outperforms the others, suggesting it is the most efficient for this particular task. The initial increase in performance for all configurations likely reflects the benefits of larger input sizes in amortizing overhead costs. The subsequent stabilization suggests that performance becomes limited by other factors, such as memory bandwidth or computational complexity, beyond a certain input length. The "Compute peak" line indicates the theoretical maximum performance, which none of the configurations reach, suggesting there is room for further optimization. The fluctuations in performance after the initial rise could be due to variations in memory access patterns or other system-level effects.