\n
## Line Chart: Mstencil/s vs. Input Length
### Overview
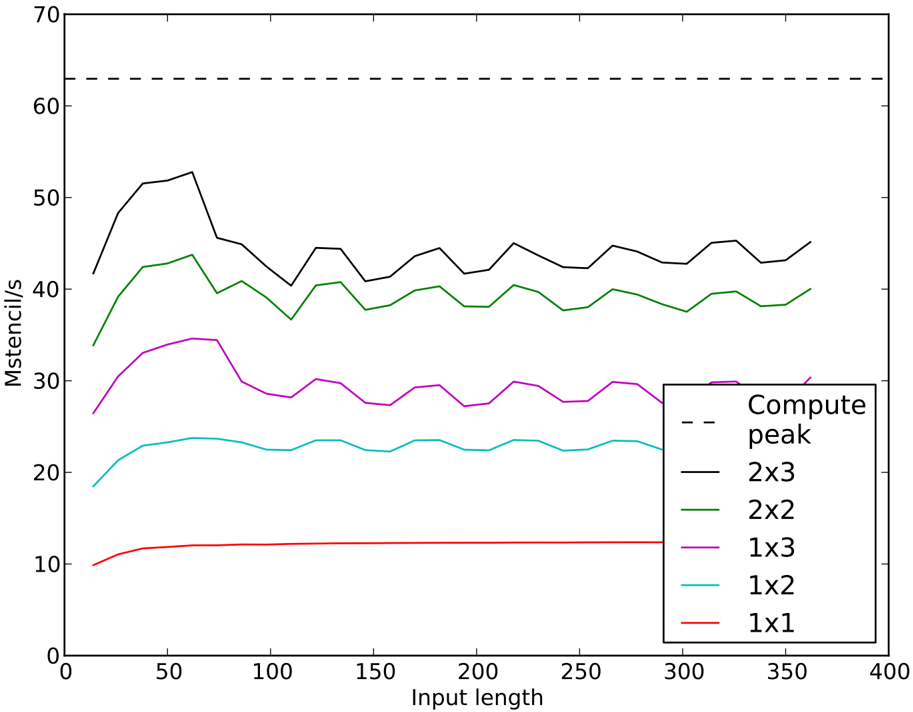
This image presents a line chart comparing the performance (measured in Mstencil/s) of different compute peak configurations as a function of input length. The chart displays six data series, each representing a different compute peak configuration (2x3, 2x2, 1x3, 1x2, 1x1) alongside a baseline "Compute peak" performance.
### Components/Axes
* **X-axis:** "Input length" ranging from 0 to 400, with tick marks at intervals of 50.
* **Y-axis:** "Mstencil/s" ranging from 0 to 70, with tick marks at intervals of 10.
* **Legend:** Located in the bottom-right corner, listing the following data series with corresponding colors:
* Compute peak (dashed black line)
* 2x3 (black line)
* 2x2 (green line)
* 1x3 (light grey line)
* 1x2 (cyan line)
* 1x1 (red line)
### Detailed Analysis
The chart displays the performance of each configuration across the input length range.
* **Compute peak (dashed black line):** This line is horizontal and remains constant at approximately 65 Mstencil/s throughout the entire input length range.
* **2x3 (black line):** This line starts at approximately 48 Mstencil/s at an input length of 0, fluctuates between approximately 40 and 52 Mstencil/s, and ends at approximately 45 Mstencil/s at an input length of 400.
* **2x2 (green line):** This line begins at approximately 40 Mstencil/s at an input length of 0, fluctuates between approximately 35 and 45 Mstencil/s, and ends at approximately 40 Mstencil/s at an input length of 400.
* **1x3 (light grey line):** This line starts at approximately 32 Mstencil/s at an input length of 0, fluctuates between approximately 25 and 35 Mstencil/s, and ends at approximately 30 Mstencil/s at an input length of 400.
* **1x2 (cyan line):** This line begins at approximately 20 Mstencil/s at an input length of 0, increases to approximately 25 Mstencil/s around an input length of 100, and then fluctuates between approximately 20 and 25 Mstencil/s, ending at approximately 22 Mstencil/s at an input length of 400.
* **1x1 (red line):** This line remains relatively constant at approximately 10 Mstencil/s throughout the entire input length range.
### Key Observations
* The "Compute peak" configuration consistently outperforms all other configurations across all input lengths.
* The 2x3 configuration generally performs better than the 2x2, 1x3, 1x2, and 1x1 configurations.
* The 1x1 configuration exhibits the lowest performance.
* The performance of most configurations (2x3, 2x2, 1x3, 1x2) fluctuates with increasing input length, suggesting some sensitivity to input size.
### Interpretation
The data suggests that the "Compute peak" configuration provides the highest performance for this stencil operation, regardless of input length. Larger compute peak configurations (2x3, 2x2) generally offer better performance than smaller ones (1x3, 1x2, 1x1). The fluctuations in performance for the 2x3, 2x2, 1x3, and 1x2 configurations could be due to factors such as memory access patterns, cache utilization, or overhead associated with parallelization. The consistent low performance of the 1x1 configuration indicates that it is likely limited by computational resources or inefficient parallelization. The chart demonstrates the trade-offs between compute peak configuration and performance, highlighting the importance of selecting an appropriate configuration based on the specific application and input characteristics.