## Line Chart: Performance (Mstencil/s) vs. Input Length for Different Configurations
### Overview
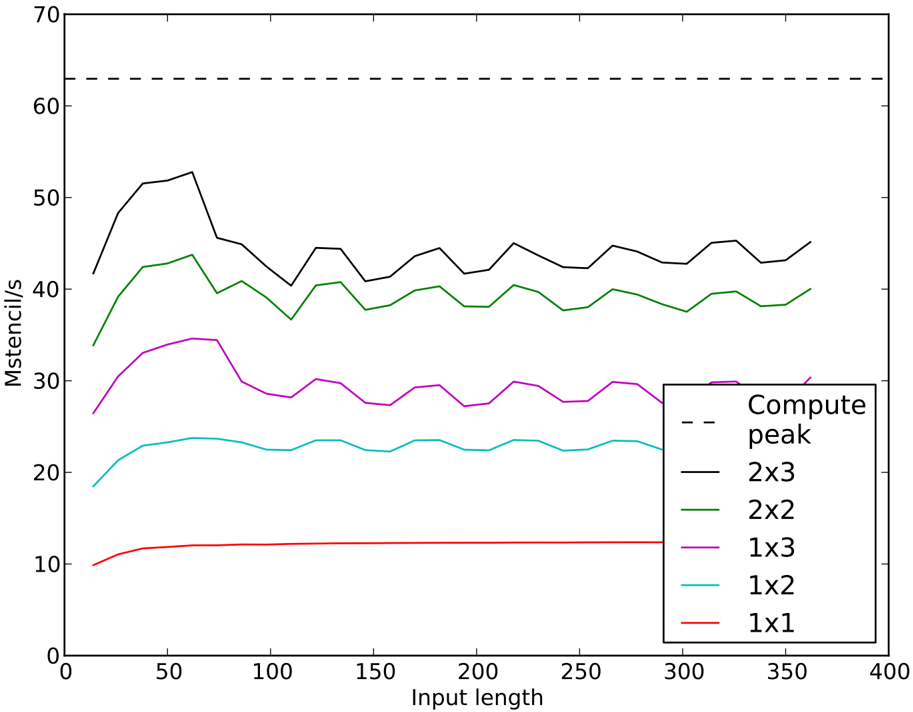
This is a line chart plotting computational performance, measured in "Mstencil/s" (millions of stencil operations per second), against "Input length." It compares the performance of five different configurations (labeled 1x1, 1x2, 1x3, 2x2, 2x3) and includes a theoretical "Compute peak" reference line. The chart demonstrates how performance scales with input size for each configuration.
### Components/Axes
* **X-Axis (Horizontal):** Labeled "Input length." The scale runs from 0 to 400, with major tick marks at intervals of 50 (0, 50, 100, 150, 200, 250, 300, 350, 400).
* **Y-Axis (Vertical):** Labeled "Mstencil/s." The scale runs from 0 to 70, with major tick marks at intervals of 10 (0, 10, 20, 30, 40, 50, 60, 70).
* **Legend:** Located in the bottom-right quadrant of the chart area. It contains six entries:
1. `Compute peak` (represented by a black dashed line `---`)
2. `2x3` (represented by a solid black line)
3. `2x2` (represented by a solid green line)
4. `1x3` (represented by a solid magenta/purple line)
5. `1x2` (represented by a solid cyan/light blue line)
6. `1x1` (represented by a solid red line)
### Detailed Analysis
**Data Series Trends and Approximate Values:**
1. **Compute peak (Black Dashed Line):**
* **Trend:** Perfectly horizontal, indicating a constant theoretical maximum.
* **Value:** Approximately **63 Mstencil/s** across all input lengths.
2. **2x3 (Solid Black Line):**
* **Trend:** Rises sharply from input length ~10 to a peak near input length 60, then exhibits a sawtooth pattern of oscillation with a slight overall downward trend as input length increases.
* **Key Points:** Starts at ~42 Mstencil/s. Peaks at ~53 Mstencil/s (input length ~60). Oscillates between ~40 and ~45 Mstencil/s for input lengths >100.
3. **2x2 (Solid Green Line):**
* **Trend:** Follows a similar sawtooth oscillation pattern to the 2x3 line but is consistently lower. Rises to an initial plateau, then oscillates.
* **Key Points:** Starts at ~34 Mstencil/s. Reaches an initial plateau of ~43 Mstencil/s (input length ~50-70). Oscillates between ~37 and ~41 Mstencil/s for input lengths >100.
4. **1x3 (Solid Magenta Line):**
* **Trend:** Rises to a peak, then settles into a lower-amplitude oscillation pattern.
* **Key Points:** Starts at ~27 Mstencil/s. Peaks at ~35 Mstencil/s (input length ~60-70). Oscillates between ~27 and ~30 Mstencil/s for input lengths >100.
5. **1x2 (Solid Cyan Line):**
* **Trend:** Rises to a stable plateau with very minor fluctuations.
* **Key Points:** Starts at ~19 Mstencil/s. Quickly reaches a plateau of approximately **23-24 Mstencil/s** and remains nearly flat across the rest of the input length range.
6. **1x1 (Solid Red Line):**
* **Trend:** Rises very gradually and then plateaus completely.
* **Key Points:** Starts at ~10 Mstencil/s. Increases slowly to a stable plateau of approximately **12-13 Mstencil/s** from input length ~100 onward.
### Key Observations
* **Performance Hierarchy:** There is a clear and consistent performance hierarchy across all input lengths: `2x3` > `2x2` > `1x3` > `1x2` > `1x1`.
* **Oscillation Pattern:** The three higher-performance configurations (`2x3`, `2x2`, `1x3`) exhibit a distinct sawtooth oscillation pattern after their initial rise, suggesting a performance characteristic that is sensitive to specific input length intervals (possibly related to cache line sizes or memory alignment).
* **Plateau Behavior:** The two lower-performance configurations (`1x2`, `1x1`) show minimal oscillation and reach stable performance plateaus relatively quickly.
* **Gap to Peak:** Even the highest-performing configuration (`2x3`) operates significantly below the theoretical "Compute peak" of ~63 Mstencil/s, with its peak performance (~53 Mstencil/s) reaching about 84% of the peak. The average performance for `2x3` at longer input lengths is closer to 70% of the peak.
### Interpretation
The chart illustrates the performance scaling of different computational configurations (likely representing thread blocks, vector widths, or similar parallelism parameters) for a stencil computation kernel.
* **What the data suggests:** Increasing the configuration size (from 1x1 to 2x3) yields substantial performance gains. The non-linear jump from `1x3` to `2x2` and then to `2x3` suggests that combining dimensions (e.g., adding a second dimension of parallelism) is more effective than just increasing one dimension.
* **How elements relate:** The "Compute peak" serves as an upper-bound benchmark. The distance between each configuration's line and this peak visualizes its efficiency. The oscillating patterns in the higher-performance lines indicate that performance is not purely a function of input size but is also affected by how the input maps to the underlying hardware architecture at specific lengths.
* **Notable anomalies/trends:** The most notable trend is the sawtooth oscillation. This is a common signature in high-performance computing where performance dips at input lengths that cause poor resource utilization (e.g., cache thrashing) and peaks at lengths that align well with hardware memory hierarchies. The flat lines for `1x1` and `1x2` suggest these configurations are likely bottlenecked by factors other than memory access patterns, such as instruction overhead or lack of sufficient parallelism to hide latency.