## Grid Diagram: Abstract Color Pattern
### Overview
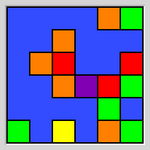
The image depicts a 5x5 grid of colored squares arranged in a non-repeating, irregular pattern. No textual elements, labels, or legends are present. The grid is bordered by a thin black outline, and each square is uniformly colored. Colors include blue, orange, red, green, purple, and yellow.
### Components/Axes
- **Grid Structure**:
- 5 rows and 5 columns (25 total squares).
- No axis labels, scales, or numerical markers.
- No legend or color-key provided.
- **Color Distribution**:
- Colors are distributed unevenly across the grid.
- No discernible pattern or gradient.
### Detailed Analysis
- **Color Counts**:
- Blue: 8 squares (32%)
- Orange: 5 squares (20%)
- Red: 4 squares (16%)
- Green: 4 squares (16%)
- Purple: 2 squares (8%)
- Yellow: 1 square (4%)
- **Spatial Distribution**:
- Blue dominates the left and top regions.
- Orange and red clusters appear in the center.
- Green and purple are scattered in the lower-right quadrant.
- Yellow occupies a single square in the bottom-left corner.
### Key Observations
- No textual or numerical data is embedded in the grid.
- The absence of a legend or labels prevents interpretation of color meaning.
- The irregular distribution suggests a non-algorithmic, possibly artistic or puzzle-based design.
### Interpretation
The image appears to be an abstract representation, potentially a puzzle (e.g., a simplified version of a nonogram or color-based logic grid). Without additional context or labels, the purpose or meaning of the color arrangement remains unclear. The lack of textual information or structured data prevents quantitative analysis. The uneven color distribution may imply a focus on visual aesthetics or a hidden pattern requiring external clues to decode.