## Chart Type: Multiple Line Charts
### Overview
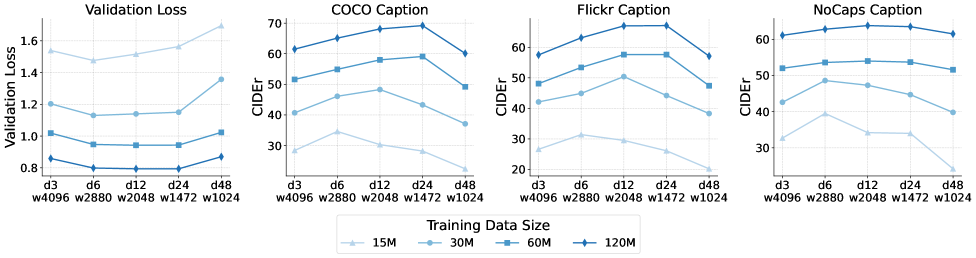
The image presents four line charts arranged horizontally. Each chart displays the performance of different models based on varying training data sizes. The first chart shows "Validation Loss," while the other three charts show "CIDEr" scores for "COCO Caption," "Flickr Caption," and "NoCaps Caption" datasets. The x-axis represents the training data size, and a legend at the bottom indicates the different training data sizes (15M, 30M, 60M, and 120M) represented by different colored lines.
### Components/Axes
* **Chart Titles (Top):**
* Validation Loss
* COCO Caption
* Flickr Caption
* NoCaps Caption
* **Y-Axes Labels:**
* Validation Loss (Chart 1) - Scale ranges from approximately 0.8 to 1.6.
* CIDEr (Charts 2, 3, and 4) - Scale ranges from approximately 20 to 70.
* **X-Axes Labels:**
* All charts share the same x-axis labels: d3 w4096, d6 w2880, d12 w2048, d24 w1472, d48 w1024
* **Legend (Bottom):**
* Training Data Size
* Light Blue (Triangle Marker): 15M
* Blue (Circle Marker): 30M
* Dark Blue (Square Marker): 60M
* Darkest Blue (Diamond Marker): 120M
### Detailed Analysis
**1. Validation Loss Chart:**
* **15M (Light Blue, Triangle):** The validation loss starts at approximately 1.55, decreases slightly to around 1.5, and then increases to approximately 1.7.
* **30M (Blue, Circle):** The validation loss starts at approximately 1.2, decreases slightly to around 1.1, remains relatively stable, and then increases to approximately 1.35.
* **60M (Dark Blue, Square):** The validation loss starts at approximately 1.0, decreases slightly to around 0.95, remains relatively stable, and then increases to approximately 1.0.
* **120M (Darkest Blue, Diamond):** The validation loss starts at approximately 0.85, decreases slightly to around 0.8, remains relatively stable, and then increases to approximately 0.85.
**2. COCO Caption Chart:**
* **15M (Light Blue, Triangle):** The CIDEr score starts at approximately 28, increases to approximately 31, and then decreases to approximately 22.
* **30M (Blue, Circle):** The CIDEr score starts at approximately 41, increases to approximately 48, and then decreases to approximately 37.
* **60M (Dark Blue, Square):** The CIDEr score starts at approximately 52, increases to approximately 58, and then decreases to approximately 49.
* **120M (Darkest Blue, Diamond):** The CIDEr score starts at approximately 62, increases to approximately 68, and then decreases to approximately 60.
**3. Flickr Caption Chart:**
* **15M (Light Blue, Triangle):** The CIDEr score starts at approximately 26, increases to approximately 31, and then decreases to approximately 23.
* **30M (Blue, Circle):** The CIDEr score starts at approximately 42, increases to approximately 50, and then decreases to approximately 38.
* **60M (Dark Blue, Square):** The CIDEr score starts at approximately 48, increases to approximately 58, and then decreases to approximately 47.
* **120M (Darkest Blue, Diamond):** The CIDEr score starts at approximately 58, increases to approximately 64, and then decreases to approximately 57.
**4. NoCaps Caption Chart:**
* **15M (Light Blue, Triangle):** The CIDEr score starts at approximately 33, increases to approximately 35, and then decreases to approximately 24.
* **30M (Blue, Circle):** The CIDEr score starts at approximately 43, increases to approximately 48, and then decreases to approximately 40.
* **60M (Dark Blue, Square):** The CIDEr score starts at approximately 52, increases to approximately 54, and then decreases to approximately 51.
* **120M (Darkest Blue, Diamond):** The CIDEr score starts at approximately 61, increases to approximately 63, and then decreases to approximately 61.
### Key Observations
* **Validation Loss:** As the training data size increases, the validation loss generally decreases up to 'd24 w1472', indicating better model generalization. However, the validation loss increases at 'd48 w1024' for all training data sizes.
* **CIDEr Scores:** For all captioning datasets (COCO, Flickr, NoCaps), the CIDEr scores generally increase with larger training data sizes. The scores initially increase from 'd3 w4096' to 'd24 w1472', and then decrease at 'd48 w1024'.
* **Trend Reversal:** All CIDEr score charts show a decrease in performance at the 'd48 w1024' mark, suggesting a potential issue with the model's performance at this specific data size or configuration.
### Interpretation
The charts suggest that increasing the training data size generally improves the CIDEr scores for image captioning tasks on COCO, Flickr, and NoCaps datasets. This indicates that the models benefit from more data in terms of generating more accurate and relevant captions. However, the increase in validation loss at 'd48 w1024' suggests that the model might be overfitting or encountering some other issue at that specific configuration, leading to a decrease in CIDEr scores. The 'd48 w1024' configuration may require further investigation or optimization to improve overall performance.