\n
## Line Charts: Model Performance vs. Training Data Size
### Overview
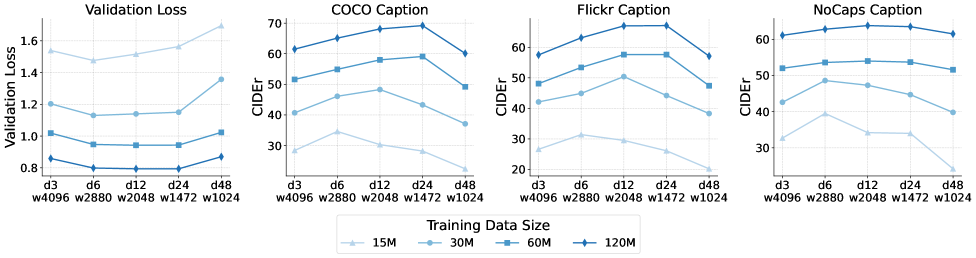
The image presents four line charts comparing model performance across different training data sizes. The charts track Validation Loss, COCO Caption CIDEr score, Flickr Caption CIDEr score, and NoCaps Caption CIDEr score. The x-axis represents different training data sizes and epochs (d3, d6, d12, d24, d48), while the y-axis represents the corresponding metric values.
### Components/Axes
* **X-axis:** Training Data Size/Epochs. Markers include: d3 w4096, d6 w2880, d12 w2048, d24 w1472, d48 w1024.
* **Y-axis (Left):** Validation Loss (ranging from approximately 0.8 to 1.7).
* **Y-axis (Middle & Right):** CIDEr score (ranging from approximately 20 to 70).
* **Legend:** Located at the bottom-center of the image.
* 15M (Light Blue)
* 30M (Blue)
* 60M (Dark Blue)
* 120M (Very Dark Blue)
### Detailed Analysis or Content Details
**1. Validation Loss Chart (Leftmost):**
* The 15M line (light blue) starts at approximately 1.65, decreases to around 1.15, then increases slightly to 1.2.
* The 30M line (blue) starts at approximately 1.5, decreases to around 0.95, then increases slightly to 1.0.
* The 60M line (dark blue) starts at approximately 1.4, decreases to around 0.85, then increases slightly to 0.9.
* The 120M line (very dark blue) starts at approximately 1.3, decreases to around 0.8, then increases slightly to 0.85.
* Overall trend: All lines decrease initially, then plateau or slightly increase. The 120M model consistently exhibits the lowest validation loss.
**2. COCO Caption Chart (Center-Left):**
* The 15M line (light blue) starts at approximately 68, decreases to around 55, then increases to 60.
* The 30M line (blue) starts at approximately 65, increases to around 60, then decreases to 55.
* The 60M line (dark blue) starts at approximately 62, increases to around 60, then decreases to 50.
* The 120M line (very dark blue) starts at approximately 60, increases to around 65, then decreases to 55.
* Overall trend: The 15M and 30M lines show more fluctuation, while the 60M and 120M lines are more stable.
**3. Flickr Caption Chart (Center-Right):**
* The 15M line (light blue) starts at approximately 65, decreases to around 50, then increases to 55.
* The 30M line (blue) starts at approximately 62, increases to around 58, then decreases to 52.
* The 60M line (dark blue) starts at approximately 60, increases to around 55, then decreases to 48.
* The 120M line (very dark blue) starts at approximately 58, increases to around 60, then decreases to 52.
* Overall trend: Similar to the COCO Caption chart, the 15M and 30M lines are more volatile.
**4. NoCaps Caption Chart (Rightmost):**
* The 15M line (light blue) starts at approximately 55, decreases to around 30, then increases to 40.
* The 30M line (blue) starts at approximately 52, decreases to around 35, then increases to 45.
* The 60M line (dark blue) starts at approximately 50, decreases to around 40, then increases to 42.
* The 120M line (very dark blue) starts at approximately 48, decreases to around 38, then increases to 45.
* Overall trend: The 15M and 30M lines show a more pronounced decrease and subsequent increase.
### Key Observations
* Increasing the training data size generally leads to lower validation loss (leftmost chart).
* The 120M training data size consistently performs best in terms of validation loss.
* The CIDEr scores (middle and right charts) exhibit more variability, and the impact of training data size is less clear-cut.
* The NoCaps Caption chart shows the most significant initial decrease in CIDEr score with increasing training data size.
* The COCO and Flickr caption charts show a more stable performance with larger training datasets.
### Interpretation
The data suggests that increasing the training data size improves model generalization, as evidenced by the decreasing validation loss. However, the impact on captioning performance (CIDEr scores) is more nuanced and depends on the specific captioning dataset (COCO, Flickr, NoCaps). The NoCaps dataset appears to benefit the most from increased training data, while the COCO and Flickr datasets show more stable performance. The initial decrease in CIDEr scores followed by a slight increase could indicate overfitting or the need for further model tuning. The consistent performance of the 120M model across all metrics suggests that it has reached a point of diminishing returns, and further increasing the training data size may not yield significant improvements. The differences in trends between the captioning datasets suggest that the difficulty and characteristics of each dataset influence the model's learning process.