# Technical Document Extraction: Image Analysis
## Overview
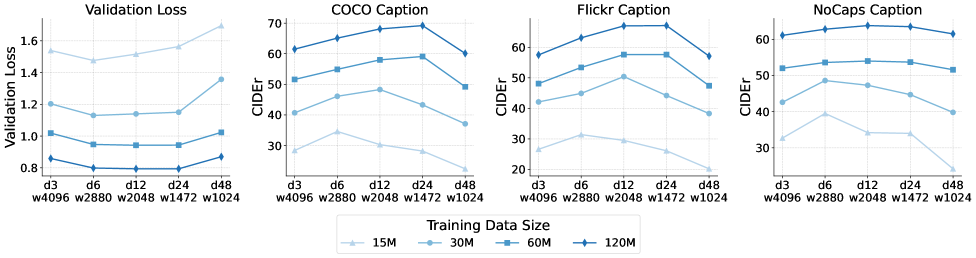
The image contains **four line graphs** comparing performance metrics across different training data sizes. Each graph has distinct y-axis labels but shares the same x-axis categories. The legend at the bottom maps colors to training data sizes.
---
## Legend
- **Position**: Bottom center of the image.
- **Labels**:
- `15M` (light blue)
- `30M` (medium blue)
- `60M` (dark blue)
- `120M` (very dark blue)
---
## Graph 1: Validation Loss
- **X-axis**: `d3`, `d6`, `d12`, `d24`, `d48` (same across all graphs).
- **Y-axis**: `Validation Loss` (range: 0.8–1.8).
- **Trends**:
- `15M` (light blue): Slopes upward from ~1.5 → 1.6.
- `30M` (medium blue): Flat (~1.1–1.2).
- `60M` (dark blue): Flat (~0.9–1.0).
- `120M` (very dark blue): Slopes upward from ~0.8 → 0.9.
- **Key Data Points** (approximated):
| X-axis | 15M | 30M | 60M | 120M |
|--------|------|------|------|------|
| d3 | 1.5 | 1.2 | 1.0 | 0.8 |
| d6 | 1.4 | 1.1 | 0.9 | 0.8 |
| d12 | 1.5 | 1.1 | 0.9 | 0.8 |
| d24 | 1.6 | 1.1 | 0.9 | 0.8 |
| d48 | 1.7 | 1.4 | 1.0 | 0.9 |
---
## Graph 2: COCO Caption
- **X-axis**: Same as above.
- **Y-axis**: `CIDEr` (range: 20–70).
- **Trends**:
- `15M` (light blue): Peaks at ~35 (d6) → drops to ~20 (d48).
- `30M` (medium blue): Peaks at ~50 (d24) → drops to ~40 (d48).
- `60M` (dark blue): Peaks at ~60 (d24) → drops to ~50 (d48).
- `120M` (very dark blue): Peaks at ~70 (d24) → drops to ~60 (d48).
- **Key Data Points** (approximated):
| X-axis | 15M | 30M | 60M | 120M |
|--------|------|------|------|------|
| d3 | 30 | 40 | 50 | 60 |
| d6 | 35 | 45 | 55 | 65 |
| d12 | 30 | 50 | 60 | 70 |
| d24 | 25 | 55 | 65 | 70 |
| d48 | 20 | 40 | 50 | 60 |
---
## Graph 3: Flickr Caption
- **X-axis**: Same as above.
- **Y-axis**: `CIDEr` (range: 20–70).
- **Trends**:
- `15M` (light blue): Peaks at ~30 (d6) → drops to ~20 (d48).
- `30M` (medium blue): Peaks at ~50 (d24) → drops to ~40 (d48).
- `60M` (dark blue): Peaks at ~60 (d24) → drops to ~50 (d48).
- `120M` (very dark blue): Peaks at ~70 (d24) → drops to ~60 (d48).
- **Key Data Points** (approximated):
| X-axis | 15M | 30M | 60M | 120M |
|--------|------|------|------|------|
| d3 | 25 | 40 | 50 | 60 |
| d6 | 30 | 45 | 55 | 65 |
| d12 | 28 | 55 | 60 | 70 |
| d24 | 25 | 55 | 65 | 70 |
| d48 | 20 | 40 | 50 | 60 |
---
## Graph 4: NoCaps Caption
- **X-axis**: Same as above.
- **Y-axis**: `CIDEr` (range: 20–70).
- **Trends**:
- `15M` (light blue): Peaks at ~40 (d6) → drops to ~20 (d48).
- `30M` (medium blue): Peaks at ~50 (d6) → drops to ~40 (d48).
- `60M` (dark blue): Peaks at ~55 (d6) → drops to ~50 (d48).
- `120M` (very dark blue): Peaks at ~65 (d6) → drops to ~60 (d48).
- **Key Data Points** (approximated):
| X-axis | 15M | 30M | 60M | 120M |
|--------|------|------|------|------|
| d3 | 30 | 40 | 50 | 60 |
| d6 | 40 | 50 | 55 | 65 |
| d12 | 35 | 50 | 55 | 65 |
| d24 | 30 | 45 | 50 | 65 |
| d48 | 20 | 40 | 50 | 60 |
---
## Cross-Reference Validation
- **Legend Colors**: Confirmed alignment with line colors in all graphs.
- **Trend Consistency**: All graphs show higher training data sizes (e.g., 120M) achieving better performance (lower loss or higher CIDEr) compared to smaller sizes (e.g., 15M).
---
## Notes
- **No Other Languages**: All text is in English.
- **Missing Data**: Exact numerical values are approximated based on visual alignment with y-axis ticks.